What are the factors which influence a sociologist’s choice of research topic?
The personal interests and values of the researchers
A Sociologist is obviously going to be more motivated to study something they are interested in – and nothing motivates quite like personal experience – Tony Sewell is an example of a Sociologists who studied a group with who he shared personal characteristics.
Theoretical perspective/ political beliefs
Whether one is a Feminist, Marxist or Functionalist/ New Right Thinker/ or Post-Modernist can influence what one studies. Feminists emphasise the importance of focussing on issues of gender inequality, so might choose to research issues such as domestic violence or the impact of the Beauty Myth, while Marxists focus on researching the impact of wealth inequalities, so might research things such as class inequalities in education. All of this raises the question of whether Sociology can remain value-free (unbiased)
Opportunity
also matters when it comes to research topic – Mac An Ghaill wanted to study the experiences of Irish students but he couldn’t study, so instead he focused on the black and Asian students in his own college.
Funding
Sociologists are professionals and need get funding for their research, so funding bodies can influence topics of research.
Society
Societies change, and so new topics of study will emerge with social changes. For example, sociologists have studied things such as rave culture, and virtual gaming communities as these have emerged, which overlaps with the first point above!
Find out more
This post has been written primarily for students studying the research methods topic within A-level sociology. For further info, please see my page on research methods.
Why do working class children do worse than middle class children in education? This post looks at some quantitative, longitudinal data to explore why.
A recent report by the Joseph Rowntree Foundation argues that early intervention is not enough to tackle the persistent differences in class inequalities in educational achievement – The report is a follow up to earlier research published March last year which is summarised below
This four page summary (and the longer document which you can get if you follow the links) is an excellent example of a quantitative approach to social research – in the tradition of Positivism (although strictly speaking, not purely Positivist). NB IF THE IMAGES AREN’T CLEAR JUST CLICK ON THEM! I’ve spent way too long faffing about with them already.
This study uses statistical data from four longitudinal studies to uncover the main ‘causal factors’ behind why children from low income backgrounds do so badly in education.
Before we get onto the ’causes’ please note that ‘educational achievement gap’ between the social classes widens as children get older. The study notes that –
The research showed that educational deficits emerge early in children’s lives, even before entry into school, and widen throughout childhood. Even by the age of three there is a considerable gap in cognitive test scores between children in the poorest fifth of the population compared with those from better-off backgrounds. This gap widens as children enter and move through the schooling system, especially during primary school years.
The report demonstrates this graphically as follows –
Differences in ‘cognitive ability’ by income and age
And you can see from the table below how the differences are greater by ages 7 and 11…
According to the study The main ’causes’ of class differences in educational achievement are –
Children from poorer backgrounds are much less likely to experience a rich home learning environment than children from better-off backgrounds. At age three, for example, reading to the child is less likely to happen in poorer households.
Reasons for the widening gap between children from richer and poorer backgrounds are:
lower parental aspirations for higher education – (81% of the richest mothers hope their child at age 9 will go to university, compared to only 39% of the poorest mothers)
how far parents and children believe their own actions can affecttheir lives;
children’s behavioural problems.
• It becomes harder to reverse patterns of under-achievement by the teenage years, but disadvantage and poor school results continue to be linked, including through:
– teenagers’ and parents’ expectations for higher education
material resources such as access to a computer and the internet at home;
engagement in anti-social behaviour;
and young people’s belief in their own ability at school.
What’s interesting is the way the stats visually display the multiple disadvantages people from low incomes face – for example –
Probably my favourite graphic of all is this – which is hopefully at least partially self explanatory
If it’s not clear from the graphic – this is saying that family background is correlated with two thirds of the difference in cognitive ability between the richest and poorest children aged three.
Overall, the main message of this study – that home background and parental aspiration matter a lot when it comes to explaining class differences in educational achievement.
The study also mentions that there are certain policy implications that need to be followed through if the government wishes to address these issues, but of course just because some research suggest certain courses of action, it doesn’t necessarily mean the government will adopt those courses of action, because of funding constraints, or ideological biases.
Here’s an interesting correlation between the quantities of books published on Pornography and Patriarchy…
This is from Google ngram viewer, which searches the content of five million books. If you take it at face value, then public interest in both pornography and patriarchy peaked around 1995, and have been declining at a similar rate ever since.
wordpress.com doesn’t allow me to embed html – but click here for the online version:
Of course I’m skeptical about whether that’s actually the case, I’ve just been messing around with Google ngrams and wanted to share my pretty graph.
Besides being perty, the above graph is useful to demonstrate the limitations of quantitative secondary data analysis…
Firstly, public interest in Patriarchy and Pornography haven’t necessarily been declining since 1995 – books may still be written about these topics, but without using these words – So people may be writing about the same things, but just using different words – an important reminder of the limitations of doing quantitative analysis using a limited range of key terms.
Secondly, we can’t necessarily compare over time – this is only a mere book search – I’m damn sure the majority of people who write about the above two topics today do so online, and when did the online writing explosion start – the late 1990, so probably books on everything decline from the mid 1990s!
Thirdly, the above obviously tells you nothing about the quality, tone, ideology of the material being produced. Are these pro or anti-books. Is it that useful to just know merely the topics that people are writing about?
I’d be interested in comments – How much does Google ngrams actually tell us about changing trends in the kind of things people are writing and reading about today?
Functionalist theorists such as Durkheim and Parsons argue that education systems are meritocracies and that they perform positive functions such as secondary socialization and role allocation, but how valid are these views today?
Before you read the material below, make sure you have a clear understanding of the functionalist view of education. You should have notes, organised into at least four points which functionalists make about the role of education in society. Then read/ watch the material below and annotate your notes, linking each piece of evidence to a particular aspect of the Functionalist theory of education, stating whether the evidence supports or critics that particular aspect of the theory (of course, some of the evidence might be ambiguous).
Evidence you could use to evaluate the Functionalist view of education
NB the evidence I present below is far from the only evidence you can use. I have tried to select a variety of qualitative and quantitative sources. You might have your own, more recent evidence you can use to evaluate Functionalism!
Whatever evidence you’re using You need to consider how valid, reliable and representative each piece of evidence is! It might be useful to brush up on your research methods knowledge before looking at the material below!
Education Yorkshire: The Case of Musharaf
Educating Yorkshire was a documentary which aired on British T.V. back in 2013. In terms of methods it used a variety of non participant observation (filmed) and interviews with mainly the students.
Musharaf was one of the main characters from this first series, and to my mind this clip is one of the best pieces of supporting evidence for the functionalist view on education – it’s a really positive story. Watch it to find out more, it’s all in there: especially solidarity at the end!
Cross National Comparisons
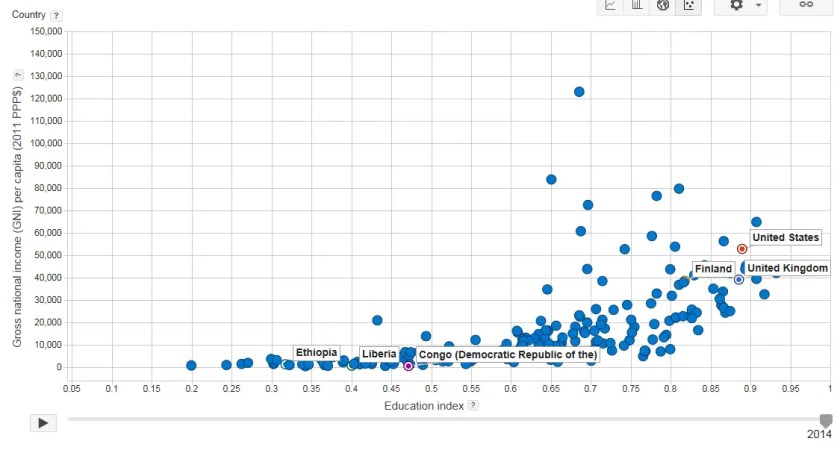
Cross National Comparisons suggest support for the Functionalist view that formal education and qualifications are functionally advantageous for society as a whole, as they are correlated with a society’s level of economic development.
Human Development statistics show a clear relationship between improved education, higher skilled jobs and economic growth. In the most developed countries such as those in Northern Europe children spend more than a decade in full time education, with the majority achieving level three qualifications (A level or equivalent) while huge numbers of children in Sub-Saharan Africa receive only a basic primary or secondary education, with actual enrolment figures in school much lower, and only a few going on to level three education or level four (university level).
You can use Google Public Data to compare a range of Education Indicators across a number of countries
Of course as a counter-criticism, it’s worth keeping in mind that correlation doesn’t necessarily mean causation in every country.
School Exclusion Statistics
Exclusion statistics suggest that the education system doesn’t act as an effective agent of secondary socialisation for every child, although the numbers of exclusions are small, with only 5% of pupils being given a fixed term exclusion and only 0.1% being permanently excluded.
However, some types of student are much more likely to be excluded – boys are three times more likely than girls, FSM students 4 times more likely than non FSM and Black-Caribbean and mixed white and Black-Caribbean 3 times more likely than the figures as a whole, suggesting that school works better for some types of student than others, which is something Functionalists do not consider.
You get a very different picture of absenteeism depending on which set of stats you look at!
Statistics on persistent absenteeism show that one in nine, or 11% of pupils are routinely absent from school, missing more than 10% of school in any one term –and the numbers are much higher for special schools, for boys and FSM students.
HOWEVER, if you look at the overall absentee rate (which looks at number of sessions missed for all students, rather than individual students) then the absentee rate is much lower – it stands at around 4.8%
So whether you see these statistics as supporting evidence for Functionalism or as criticizing Functionalism is kind of open to interpretation!
The correlation between employment and education
Employment statistics from the ONS demonstrate a strong correlation between educational level, employment skill level and income – those with GCSEs earn 20% more than those without GCSEs and those with degrees earn about 85% more than those with only GCSEs. This set of statistics from The Poverty Site further demonstrates that those with poor GCSCEs/ no qualifications are approximately five times more likely to either be unemployed or in low paid-work (less than £7/ hour) compared to those with degrees. This demonstrates at least partial support for the theory or Role Allocation – the higher your qualification, the better paid job you get (although this says nothing about whether this is meritocratic).
To simplify it – for 16-64 year olds, on average, graduates earn about £8K more a year than non-graduates and postgraduates earn another £8K year a more than graduates.
More recent data from the Labour Force Survey shows that those with a level 4 qualification earn almost twice as much as those with no qualifications, in 2019.
And data from 2018 suggests that working age graduates earn £10 000 a year more on average than non-graduates.
However, the gap between the earnings of non-graduates and graduates has narrowed in the last decade… .In 2005 graduates earned 55% more than non-graduates, but by 2015, they only earned 45% more.
Longitudinal Studies
Criticising the view that schools are meritocratic, A recent Longitudinal Study found: ‘three years after graduation, those from more advantaged socio-economic backgrounds and those who attended private schools are more likely to be in the ‘top jobs’….
‘This research shows that even if we compare students from the same institution type, taking the same subjects and with the same degree class, socioeconomic status and private schooling still affects an individual’s chance of securing a top job,’ the report concluded.
‘An individual who has a parent who is a manager and who attended a private school is around 7 percentage points more likely to enter the highest status occupations. Male graduates from a managerial background who attended a private school are around 10 percentage points more likely to enter the highest status occupations.
But academics do not know whether the advantage given to private school pupils is simply the ‘old boys’ network’ or whether they learn better social skills so appear more confident in job interviews.
‘Our results indicate a persistent advantage from having attended a private school. This raises questions about whether the advantage that private school graduates have is because they are better socially or academically prepared, have better networks or make different occupational choices.’
Ken Robinson (a Post Modern View)
This TED talk by Ken Robinson (An RSA animated video of a talk) – Offers several criticisms of the contemporary education system – you could loosly call this a post-modern/ late modern criticism of the role of modernist education, which also criticizes the Functionalist paradigm that school performs positive functions:
In short, Robinson argues that modern education lets most kids down in the following ways –
It stifles their creativity by focusing too much on academic education and standardised testing – kids are taught that there is one answer and it’s at the back, rather than being taught to think divergently.
It tests individual ability rather than your ability to work collaboratively in groups (which you would do in the real world).
Lessons are dull – out of touch with children who are living in the most information rich age in history.
It medicates thousands of kids with Ritalin – which Robinson sees as the wrong response to kids with ADHD – we should be stimulating them in divergent ways.
This is an evaluative posts – click here for a reminder of the key skills in sociology and an explanation of different ways you can evaluate perspectives.
According to recent studies, China is home to one of the best education systems in the world, while Britain is trailing a long way behind. In some studies Chinese students are three years ahead of British students in reading and writing ability.
China is well known for its ‘tough education’ methods, but can these methods be used to improve the performance of British students? In a recent BBC documentary: ‘Are our kids tough enough? Chinese school’ a field experiment was conducted to find out.
Five Chinese teachers took over the education of a class of fifty Year 9 pupils at Bohunt School in Liphook and taught them (in one class of 50!) using Chinese teaching methods for a month, and then tested in English, Maths, Science and Mandarin, and the results compared to other students who remained receiving a more typical British Education.
The main features of the Chinese School consisted of:
The school day being 12 hours long with a 7 a.m. start consisting of a flag raising ceremony and outdoor exercises.
In the classroom, most lessons were essentially lectures. Teachers stood at the front writing the theory on the board, while the students (were supposed to) take notes and learn.
PE was a compulsory – and students were timed, tested and ranked against each other.
Results
The ultimate test of the experiment was to see if Chinese teaching methods improved educational performance – which they did (or at least appeared to have – see below). Students who attended the Chinese School for four weeks scored about 10% points (on average) higher in Mandarin, Maths and Science and they also did better in English, but with a smaller margin.
The experiment also revealed that there was something of a culture clash – those students were not particularly self-disciplined or well-behaved did not respond well to a Chinese style of teaching which is less student-centered and not as inclined to encourage individualism.
Limitations of the field experiment
I say that the Chinese-School kids achieved better test scores – what we’re not told is how much they improved, or what their ability was compared to the control group. I’m assuming all this was controlled for.
The Hawthorne Effect might apply – the improved results might be a result of the students knowing their involved in an experiment (and knowing they’re on TV) or the better results might simply exposing the kids to something different, rather than it being about those exact Chinese methods (a change is as good as a rest!)
It’s also not clear how representative this school is – Bohunt seems to be a brilliant school, enlightened (which is reflected in getting involved in this whole experiment in the first place). Would you get the same findings somewhere else?
Ethics: Some (wrong) individuals might try and argue that some of the children experienced harm to their self-esteem by being ranked in PE (other (right) individuals might argue this is just life, tough, get over it kiddo).
How useful are official statistics for understanding differences in educational achievement by social class, gender and ethnicity?
How do GCSE results vary by social class, gender and ethnicity?
The data below is taken from either the Department for Education’s document – Key Stage 4 performance 2019 (Revised), or Gov.uk ‘ethnicity facts and figures‘. The later shows data from 2017/18 (at time of writing this), but it is much more accessible than the ‘Key Stage 4 document’.
Firstly – GENDER – Girls outperformed boys in all headline measures in 2019.
For example 46.6% of girls achieved both English and Maths at grade 5 or above, compared to only 40.0% of boys, and girls are much more likley to be entered for the Ebacc than boys (45.9% compared to 34.3%
Secondly – ETHNICITY – Chinese pupils are the highest achieving group. 75.3% of Chinese pupils achieved a ‘strong pass’ (grade 5 or above) in English and Maths, with Indian pupils being the second highest achieving group, at 62%
Black Caribbean pupils have the lowest achievement of any ‘large’ ethnic minority group, with only 26.9% achieving a grade 5 or above in English and Maths
Gypsy/ Roma and Irish Traveller pupils have the lowest levels of achievement with only 9.95 and 5.3% respectively achieving a strong pass in English and Maths.
Thirdly – SOCIAL CLASS – Here, instead of social class we need to use the Department for Education’s ‘disadvantaged pupils’ category, which is the closest we’ve got as a proxy for social class, but isn’t quite the same!
The DFE says that “Pupils are defined as disadvantaged if they are known to have been eligible for free school meals in the past six years , if they are recorded as having been looked after for at least one day or if they are recorded as having been adopted from care”.
In 2019, only 24.7% of disadvantages pupils achieved English and Maths GCSE at grade 5 or above, compared to almost 50% of all other pupils, meaning disadvantaged pupils are only half as likely to get both of these two crucial GCSEs.
Some Strengths of Official Statistics on Educational Achievement by Pupil Characteristic
ONE – Good Validity (as far as it goes) – These data aren’t collected by the schools themselves – so they’re not a complete work of fiction, they are based on external examinations or coursework which is independently verified, so we should be getting a reasonably true representation of actual achievement levels. HOWEVER, we need to be cautious about this.
TWO – Excellent representativeness – We are getting information on practically every pupil in the country, even the ones who fail!
THREE – They allow for easy comparisons by social class, gender and ethnicity. These data allow us to see some pretty interesting trends – As in the table below – the difference between poor Chinese girls and poor white boys stands out a mile… (so you learn straight away that it’s not just poverty that’s responsible for educational underachievement)
FOUR – These are freely available to anyone with an internet connection
FIVE – They allow the government to track educational achievement and develop social policies to target the groups who are the most likely to underachieve – These data show us (once you look at it all together) for example, that the biggest problem of underachievement is with white, FSM boys.
Some Disadvantages of the Department for Education’s Stats on Educational Achievement
ONE – If you look again at the DFE’s Key Stage four statistics, you’ll probably notice that it’s quite bewildering – there are so many different measurements that it obscures the headline data of ‘who achieved those two crucial GCSEs’.
When it comes to the ‘Attainment 8’ or ‘Progress 8’ scores, it is especially unclear what this means to anyone other than a professional teacher – all you get is a number, which means nothing to non professionals.
TWO – changes to the way results are reported mean it’s difficult to make comparisons over time. If you go back to 2015 then the standard was to achieve 5 good GCSEs in any subject, now the government is just focusing on English and Maths, Ebacc entry and attainment 8.
THREE – These stats don’t actually tell us about the relationship between social class background and educational attainment. Rather than recording data using a sociological conception of social class, the government uses the limited definition of Free School Meal eligibility – which is just an indicator of material deprivation rather than social class in its fuller sense. Marxist sociologists would argue that this is ideological – the government simply isn’t interested in measuring the effects of social class on achievement – and if you don’t measure it the problem kind of disappears.
FOUR – and this is almost certainly the biggest limitation – these stats don’t actually tell us anything about ‘WHY THESE VARIATIONS EXIST’ – Of course they allow us to formulate hypotheses – but (at least if we’re being objective’) we don’t get to see why FSM children are twice as likely to do badly in school… we need to do further research to figure this out.
No doubt there are further strengths and limitations, but this is something for you to be going on with at least…
Official Statistics are numerical information collected and used by the government and its agencies to make decisions about society and the economy.
This post considers some of strengths and limitations of using official statistics in social research, focusing on practical, theoretical and ethical factors.
Official statistics are a type of secondary quantitative data and are one of the main methods you need to know about for the research methods component of A-level sociology.
Theoretical Factors
Theoretical advantages
Official Statistics make it very easy to get an overview of social life in Britain by, for example, clicking on the ‘UK snapshot’ or ‘focus on’ links on the ONS homepage.
Official statistics enable us to make comparisons between social groups and regions. The UK National Census is a good example of this.
They enable us to make historical comparisons over time because they often go back a long way – The British Crime Survey goes back to 1982 for example, League Tables go back until 1988 and and the UK Census goes back to 1841.
One of the most obvious strengths of official statistics is easy comparisons over time
Some large data sets might not exist if they were not collected by the government – because individuals and universities simply don’t have the funds to do such large-scale research as required by the Census, while large private companies would only focus on data collection which is profitable.
Official Statistics are favoured by Positivists because they allow us to spot trends, find correlations and make generalisations. They also allow the research to remain detached so there is less room for the subjective bias of the researcher to interfere with the research process.
Theoretical Disadvantages
Some Official Statistics lack validity. Crime statistics are a good example of this – certain crimes are notorious for being under-reported to the police – such as Rape and Domestic Violence for example.
The way that some social trends are measured changes over time – sometimes making historical comparisons difficult. For example, they way the Police Recorded Crimes changed twice in 2000s.
Official statistics may also lack validity because they are collected by the state and massaged to make things look better than they actually are. The UK government has changed the way unemployment is measured several times over the last decades, typically bringing the number of officially unemployed people down – for example by reclassifying anyone who is receiving unemployment benefit but on a work-related training course as not being unemployed.
Marxist and Feminist Sociologists argue that official statistics serve the interests of elite groups – Data is only collected on things which do not harm those in power. Marxists argue that Corporate Crime and Financial Crimes of elites are not focused on by the government, while Feminists argue that domestic violence is not taken seriously by the state.
Feminists argue that more than 1/1000 women are victims of sexual offences annually
Similarly, official statistics reflect the biases and prejudices of those in power – The fact that African-Caribbeans and Muslims are over represented in prison suggests people from these groups have higher levels of criminality. But according to Marxist criminologists this is not the case – such groups are over-represented in jail because of racial profiling by the police – the police spend more time actively policing the black and Muslim communities (with more stop and searches for example) and this is what leads to the higher arrest and imprisonment rates. Official Statistics thus give us a misleading impression of reality.
Practical Factors
Practical advantages
Many official statistics are freely available to researchers and the general public. This is a distinct advantage over ‘privately collected data’ which is collected by companies – Facebook and Amazon, for example, have a lot of data on individuals, but they are not going to share it for free! Official Statistics are more likely to shared with the public because they are paid for by taxes.
They are generally easy to access and to navigate – by using the Office for National Statics (ONS) web site for example.
It is possible to access many official statistics from home, and you can do comparative social research without needing any ‘people skills’.
Practical Disadvantages
Even though these statistics are free, they are far from cheap to collect. The ONS employs 4000 people merely to collate this data. On top of this, think of the time it takes other government officials to collect data. The Census in 2011 cost hundreds of million pounds to produce.
Official Statistics are collected for administrative purposes rather than for research purposes. Thus the data which exists and the categories and indicators used might not fit a researcher’s specific research purposes.
Ethical Factors
Ethical Advantages
Official Statistics are collected in the ‘national interest’ and so avoid the biases of private research, which would only collect data which would be of interest to the particular researcher, or data which is is profitable.
Official Statistics enable us to check up on the performance of public bodies such as the police and schools, making sure tax payers’ money is spent efficiently.
Ethical Disadvantages
The collection of some statistics can have harmful effects.
The introduction of school league tables and the requirement that schools publish there results has led to more teaching the test, a decline in creativity in education, and education generally being much more stressful for both pupils and teachers.
The collection of statistics might really be about surveillance and control – The collection of data on school performance for example enables control of teachers while the collection of data on pupils allows ‘problem pupils’ to be identified and managed by social services from a young age.
Secondary Qualitative Data is information that already exists in written or audio visual format. Secondary Qualitative Data typically take the form of documents – and there are a huge variety of them. They include government reports, newspapers, novels, letters, diaries, as well as pictures, and television and radio output.
It is useful to distinguish between official and personal sources of secondary qualitative data:
Official Documents are produced by organisations such as government departments and their agencies as well as businesses and charities and include OFSTED and other official government enquiries. These reports are a matter of public record and should be available for anyone who wishes to see them.
Personal documents are first-hand accounts of social events and personal-experiences, and they generally include the writer’s feelings and attitudes. They include such things as letters, diaries, photo albums and autobiographies.
Personal Documents may sometimes be referred to as Life Documents
Life documents are created by individuals and record details of that person’s experiences and social actions. They are predominantly qualitative and may offer insights into people’s subjective states. They can be historical or contemporary and can take a wide variety of forms. Ken Plummer (1982) illustrates this diversity when he says: “people keep diaries, send letters, take photos, write memo’s, tell biographies, scrawl graffiti, publish memoirs, write letters to the papers, leave suicide notes, inscribe memorials on tombstones, shoot films, paint pictures, make music and try to record their personal dreams.”
Strengths of Using Documents in Social Research
There is a wealth of different types of secondary qualitative information available – it is the richest vein of information available to researchers in many topic areas.
Sometimes documents might be the only means of researching the past.
Interpretivists generally favour using life documents in social research as they are not produced by the researcher, but written by respondents for their own purposes. This means they should give us an insight into the author’s own world view and meaning. This, of course, depends on us being able to verify the credibility and authenticity of documents (See limitations below).
At a practical level, many public documents are freely available to the researcher, and many of them are very in depth.
Ethically there are few issues with accessing public documents.
Limitations of Using Documents in Social Research
John Scott (1990) identifies four potential theoretical limitations which might undermine the usefulness of historical documents.
The document may lack authenticity – Parts of the document might be missing because of age, and we might not even be to verify who actually wrote the document.
The document may lack credibility – We may not be able to verify why somebody wrote the document, and what their motive was. We need to know if the document has been distorted for political reasons, for example, because this would mean they would put a spin on the content.
Meaning – It may be hard to interpret the meaning of the documents if they are written in an archaic language. With older documents it is not possible to get the authors to clarify what they meant if they are dead.
Representativeness – Documents may not be representative of the wider population – especially a problem with older documents. Many documents do not survive because they are not stored, and others deteriorate with age and become unusable. Other documents are deliberately withheld from researchers and the public gaze, and therefore do not become available.
In Summary: The main types of secondary data which you are likely to investigate as part of an A-level sociology course includes:
Official Documents:
Government Reports (‘public documents’)
Company reports and accounts (‘private documents’)
Personal Documents (or ‘life’ documents)
letters (including suicide notes)
diaries, blogs and vlogs
Individual Social media profiles
graffiti
autobiographies
Media Output:
The News (and ‘Fake News)
Various websites – Wikipedia should be of special interest to students
How useful is secondary qualitative data when researching education? This post considers some of the theoretical, practical and ethical limitations of Public and Personal Documents which are produced in the context of education – such as OFSTED reports, school prospectuses, school reports and messages sent between pupils.
Public Documents
Personal Documents
Ofsted and Inspection Reports
School Websites
School prospectuses
School policy documents
School text books
School reports on pupils
Pupils written work
Pupils’ and teachers’ diaries
Notes and text messages passed between pupils
Practical Issues with using documents when researching education
Since the 1988 education act many Public documents on education are freely available to the public – OFSTED reports on schools are easily obtainable, and schools publish a wide variety of information about themselves in their prospectuses and on their websites.
Schools also publish a huge variety of policy documents – such as student codes of conducts, equal opportunities policies and information about how they implement every child matters and safeguarding policies – all of which are likely to be made available to researchers on request, since they are a matter of public record. These are useful as they give an account of the ‘official’ picture of schools in Britain from the perspective of management.
Theoretical Issues with using documents when researching education
In terms of validity, while school web sites and prospectuses can be trusted to provide some basic information about what subjects are on offer, GCSE results and extra-curricular activities, the credibility of such sites is undermined by the fact that they produced to advertise the school in a positive light, and all of these web sites put a positive spin on the school or college. For example, although schools are required to publicise their results, they do have some freedom to emphasise the way they report them so they can portray themselves in the best possible light.
To what extent do school web sites provide a valid picture of school life?
Suggested activity: Visit the web sites of your past school and present college – to what extent do they give you an accurate picture of what life was actually like in that school?
Extension activity: Look at the web site from another school in your area. Pick one that is very different in terms of results and so on. Are the impressions you get of the two schools that different, or are they quite similar, which would suggest that school web sites are designed to a formula and really tell you very little about a particular school.
OFSTED reports may provide greater insight into what’s going on in a school than the statistical snap shot of the yearly GCSE results, but OFSTED inspections only last for three days, and are typically only done every four years, so it is quite easy for a school to put on an act for this short a period and produce a performance which is better than usual.
Might some schools be able to put on a better performance than usual during a brief OFSTED inspection?
Conversely, there are some schools that feel as if they have been harshly judged by OFSTED inspectors, and question the validity of OFSTED reports, feeling that the grade they’ve been awarded does not reflect the reality of school life. This is partly because OFSTED inspectors only really get to see one lesson by each teacher, which is not representative, but also because the focus of different OFSTED inspectors will be different in different schools, raising the prospect that schools are not being judged by the same standard.
Policy documents produced by schools, such as student codes of conduct might be useful for seeing how schools function in an ideal-world, but they lack validity in that they tell you nothing about how many students actually stick to the code of conduct or what’s done with students who break the code of conduct. If you wanted to get more of an insight into this, a researcher would have to gain access to individual reports of each student, which would be more difficult to obtain.
Representativeness and Public Documents in Educational Research
All schools and colleges are required to publish prospectuses and results, so these should cover a 100% sample of educational institutions, but the same cannot be said of OFSTED reports – schools graded outstanding go into ‘light touch’ mode and may not be observed for several years.
Using Personal Documents to Research Education
Suggested starter activity – Have a browse of this interesting blog – ‘Scenes from the Battleground’ – which has had over a million hits and is written by a teacher. What impression does this give you school life? How valid and representative do you think it is?
Personal documents in the context of education include school reports on pupils, pupils written work, pupils’ and teachers’ diaries and Notes and text messages passed between pupils
Practical Issues
For a start, these will be very difficult to access. Things like teacher mark books, records of conversations with students, and disciplinary records may not be available because of the ethical requirement to safeguard children’s privacy. The same could also be true of the written work of pupils.
Where private messages and texts are concerned, it is unlikely that researchers will be allowed access to students personal mobile phones or tablets, and even if they could gain access, threads of conversation may have been deleted shortly after they took place, and the more ‘anti-school’ such messages are, the more likely they are to have been deleted.
Validity and Personal Documents
The kind of personal documents which are readily available are likely to be of a public nature (social media accounts for example) and because they are public, they would have been subjected to impression management so they are acceptable – so while this can give us an insight into what teachers and staff think is socially acceptable, using these to give us a picture of what people actually think about school life is problematic. The more ‘personal’ and private a document is, then the higher the validity is likely to be – however, the number of people who write down in-depth personal accounts of their school experiences is tiny.
Representativeness
If one could gain access to social media accounts and personal messaging services, representativeness should be good as the majority of students have access and make use of these services.
As mentioned above, hardly anyone keeps diaries any more, and so representativeness here is a problem.
If a researcher is lucky enough to gain access to disciplinary records, these may not be representative of the actual underlying patterns of student disobedience – teacher bias may increase the number of certain types of students who have undergone disciplinary procedures.
Ethical Issues when using public and private documents in educational research
There are no particular ethical problems with using publicly produced documents,
When using private or personal documents, there are some ethical concerns. If the researcher is given access to teacher mark books, records of conversations with students, and disciplinary records this won’t necessarily be with the informed consent of the pupils for example.
healthy life expectancy isn’t keeping pace, and the sheer cost of looking after the elderly in the context of family-individualism make the ageing population a problem!
Populations across Europe are getting older which can create social problems related to higher levels of poor health among older people and a greater financial and caring ‘burden’ on younger generations.
But careful social planning can help to overcome these challenges.
What are the consequences of an ageing population?
In 1850,half the population in England were dead before they reached 46. Now half the population in England are alive at 85; and 8 million people currently alive in the UK will make it to 100 years or more. And if we extrapolate that to Europe, we can say 127 million Europeans are going to live to 100.
Hans Rosling points out that: We reached the turning point five years ago when the number of children stopped growing in the world. We have 2 billion children. They will not increase. The increase of the world population from now on will be a fill up of adults.
Health Secretary Jeremy Hunt: The two biggest issues that we face as an ageing society are the sustainability of the NHS and the sustainability of the pension system; and within the NHS, I include the social care system as part of that.
The basic problem we have in Northern European countries is the generational tension between individualism and communal responsibility – Across the generations within a typical family we have become more individualistic and less collective/ communal:
People in their 80s (who grew up in the 1960s) are generally very individualistic – they have retired into property wealth and are unwilling to relinquish the independence this gives them. They have also socialised their children into being more independent: most people today in their 50s (the children of those who are in their 80s) have bought into this – The family norm is one of the typical 50 year old living an independent life with family, miles away from their own parents.
Grandparents today of course help out with childcare occasionally and pay regular visits, but they are generally not taking a day to day role in childcare, and finances are kept separate. This arrangement is mutual – People in their 80s don’t want to be burdens on their children, they want them to have the freedom to live their own lives – to be able to work and raise their children without having to care for them in their old age. (So I suppose you might call the 2000s the era of the individualised family).
(This is very different to what it used to be like in the UK, and what it is still like in many other parts of the world where grandparents live close by and are an integral part of family life, taking an active role in raising their grandchildren on a day to day basis. Various interviewees from less developed countries testify to this, and to the advantages of it.)
Within this context of increasing ‘familial-individualism‘ a number of problems of the ageing population are discussed:
Increased family individualism
One of the main problems which this increasing ‘familial-individualism’ creates for people in their 80s is one of increasing isolation and loneliness as their friends and neighbours move away or die.
One proposed solution is for older people to be prepared to move into communal supported housing where there are shared leisure facilities, like many people do in Florida. However, people are quite set in their ways in the UK and so this is unlikely. A second solution, which some immigrants are choosing is to return to thier country of origin where there are more collectivist values, trading in a relatively wealthy life in the UK for less money and more community abroad.
Healthy Life Expectancy
A second problem is that healthy life expectancy is not keeping pace with life-expectancy, and there are increasing numbers of people in their 80s who spend several years with chronic physical conditions such as arthritis, and also dementia – which require intensive social care.
Low ‘healthy life expectancy’ is more of a problem for the most deprived
As with the first point above, this is more of a social problem when children do not see it as their duty to care for their elderly parents – It is extremely expensive to provide round the clock care for chronic conditions for several years, and this puts a strain on the NHS. Basically, the welfare state cannot cope with both pensions and chronic care.
One potential solution to the above is mentioned by Sally Greengross: the Germans in some cases now export older people to Eastern European countries because they can’t afford – or they say they can’t – to provide all the services they need in Germany itself. Could this be the future of chronic elderly care in the UK – Exporting dementia patients to poorer countries?
However, the idea of care-homes themselves are not dismissed when it comes to end of life care – the consensus seems to be that the quality of care in UK elderly care homes is generally very good, and better than your typically family could provide (despite all the not so useful scare programmes in the media).
No money left for the young
A third problem is for those in their 50s – with their parents still alive and ‘sucking money out of the welfare state’ there is less left for everything else – and this has been passed down to the youngest generation.
As a result people in their 50s now face the prospect of their own children living at home for much longer and having to help them with tuition fees and mortgage financing, meaning that their own plans for retirement in their late-50s/ early 60s are looking less likely – In other words, the next two generations are bearing a disproportionate cost of the current ageing population.
Worryingly, there is relatively little being done about this in government circles – Yes, the state pension age has been raised, and measures have been taken to get people to bolster their own private pensions, but this might be too little to late, and it looks like little else is likely to be done – The issue of the ageing population and the cost of welfare for the elderly is not a vote-winner after all.
The programme concludes by pointing out that pensions and care homes are only part of the debate. What will also be needed to tackle the problems of the ageing population is a more age-integrated society, a possible renegotiation at the level of the family so that grandparents are more integrated on a day to day basis in family life (trading of child care for a level of elderly care) and also social level changes – to make work places and public places more accessible for the elderly who might be less physically able than those younger than them.
A related topic in the Global Development module is the question of whether ‘overpopulation’ is a problem – an informed view on this topic is that of Hans Rosling’s who argues that ‘overpopulation’ isn’t really a problem at all because of the rapid global decline in birth rates.