The legal age of marriage in the UK rose from 16 to 18 years of on Monday 27th February 2023.
The reason behind this was to protect vulnerable teenagers aged 16 to 17 being manipulated or coerced into marriage against their will.
There have been thousands of cases of forced marriage in recent years where children, many from Asian backgrounds, have been taken out the United Kingdom shortly after their 16th birthdays and made to perform marriage ceremonies to men they have never met before.
This is usually arranged by their elderly family members without the child’s prior knowledge and can sometimes result in the child returning home weeks or months later already pregnant and with her new husband.
Preventing forced marriage of children is one of the United Nations Millennium Development Goals and marrying off a child agains their will is a breach of international human rights.
With this change to the legislation, 16 and 17 year olds are now brought under similar levels of protection against harm as we find with the laws forbidding alcohol and cigarettes.
A recent BBC News article explored this issue from the experience from the point of view of two victims of arranged child marriage, one of whom pointed out that at age 16 she didn’t realise that she was being coerced and that it should have been the duty of every adult to safeguard her.
This new law should make teenagers much less likely to go through this as most parents will not be prepared to break U.K. law for the sake of tradition.
Relevance to A-level Sociology
this material is a useful update to the marriage and divorce topics and childhood topics within the families and household option, usually taught as part of the AQA’s A-Level sociology in the first year of study.
Sociology students should be well aware that we live in age of persistently high divorce rates, with almost half of all marriages ending in Divorce.
While marriage is usually a result of romantic love, and the first months and even years might well be pleasant, eventually mere practical concerns such as money, career changes, and especially childcare can put a strain on marriage resulting in a divorce that neither partner wants.
Jeannie Suk Gersen is a Professor of Law at Harvard Law School who suggests that divorce lawyers should become marriage guidance counsellors and work with couples before they get married in order to get them to reflect on the kinds of things that lead to divorce, and to effectively agree on the kinds of practical questions that can put strain on a marriage which result in Divorce.
The idea is that IF couples think through the kind of problems which usually put strain on a marriage several years down the line, they’ll be better prepared to cope with that strain and divorce will be less likely.
There are three types of question/ issues that couples should work with pre-marriage counsellors to sort out before getting married:
What are one or both of you giving up in order to get married and what should the appropriate compensation be?
How are you going to sort out childcare? (There is no such thing as free childcare)
What property do you want to keep as yours rather than it becoming ‘property of the marriage’?
These are the kind of things couples don’t usually think about when making the commitment to get married, which results in ‘hidden sacrifices; being made by one partner’ which can breed resentment over the years resulting in Divorce.
For example, one partner may give up or take a step back in their career to move to a new city where their partner maintains their career.
Most couples don’t appreciate just how much mundane labour is involved with childcare or how much it costs to arrange babysitters etc. This is something that couples REALLY need to think about before marriage if they intend to have children.
Finally, if they have investments they want kept separate, they need to sort this out in advance of getting married.
These are the three questions that most commonly have to be answered when couples file for formal divorce – and it’s certainly not a matter of romance at that point. Couples have to agree on an economic value of the money lost from the career one of them gave up when they moved or on the cost of the free childcare they’ve given, in relation to the income coming in from the other partner, for example.
Gerson came up with this idea from the course she teaches in family-divorce law. She says she’s received lots of emails from her ex-students telling her how useful knowing about these questions had been in their own relationships.
Her point is that trying to put an economic value on what one person has ‘given up’ and what their compensation should be BEFORE getting married – that should help prevent resentment because both partners are in agreement from day one, rather than there being unspoken about subjective differences in what each person is giving to the relationship, purely in practical and financial terms.
There is an interesting link here to arranged marriages – it is precisely these kind of things that the parents of two people in an arranged marriage will sort out – that there is a kind of ‘equality’ in practical terms and that the partners are a good match in this sense.
In non western cultures – this is considered – sorting out practical considerations about money are sorted out at the start of the marriage journey, then it allows room for romance to start
The theory is this – if we can sort out the pragmatic arrangements of a marriage first, this should allow more room for fun and romance, and the marriage has more chance of success.
It’s especially relevant to Late Modern perspectives on the family:
This is the kind of social development that Anthony Giddens foresaw many years ago – experts becoming more involved in the running of people’s personal lives, it’s an extension of expert systems into people’s life-worlds.
It’s also the formalisation of the negotiated relationship mentioned by Ulrich Beck – kind of a development of it, spelling out the domains that should be negotiated – the kind of areas that couples don’t talk about – or maybe the fact that this is being suggested here tells us that couples over the last decades haven’t really been ‘negotiating’ their relationships that successfully!
Ultimately it also shows us an example of reflexivity in society – and is a criticism of Postmodernism – in this example we see that MOST of us agree that divorce is desirable and we take conscious steps to actively reduce the likelihood of it happening – which suggests Giddens’ idea of the late modern society is more appropriate than postmodernity, which suggests there is no such thing as truth anymore. This isn’t the case here – the agreed upon truth is that ‘divorce is bad’ and there’s an attempt to refine a solution.
The problem – is there’s no demand for this kind of pre-marriage service!
When you’re about to get married, you’re in love – the last thing you want to think about is codifying and quantifying that relationship into a points system which is what is being suggested here.
Also many millennials just aren’t that pragmatic – they’d rather tell the story of romantic love than this cold and calculated approach to a relationship.
AND, will this work – in the early days of a relationship you are in the phase of ‘showing what you show’, and ‘hearing what you want to hear’ – either partner could easily over-promise.
And in England at least, talking about money is vulgar – it’s not appealing.
Finally you can’t plan for every future eventuality with children – they have this habit of being…. unpredictable at times!
Find out More
I summarised the above from an excellent radio 4 episode of Positive Thinking – you can listen to it here.
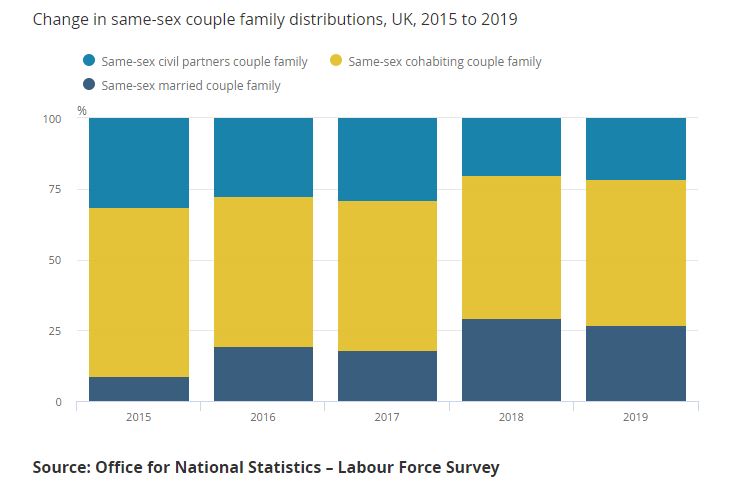
This post explores the similarities and differences in marriage and civil partnership between same sex and opposite sex couples in England and Wales. It has been written to fit in with the A-level Sociology families and households specification.
The introduction of the Civil Partnerships Act in 2005 saw a huge number of male and female same sex couples becoming civil partners, with the yearly number of civil partnerships stabilising at just over 6000 a year in the late 2000s.
The introduction of same-sex marriage in 2014 saw a further drop, so that now there are just under 1000 civil partnerships a year, with male couples slightly more likely to form them than female couples.
It seems that marriage is taking over from civil partnerships.
The ONS reported in 2017 that ‘A total of 4,850 marriages were formed between same sex couples in 2014. Of these, 44% (2,129) were between male couples and 56% (2,721) were between female couples.’
This is an interesting article by the PEW global research center which explores briefly the 20 or so countries in which same sex couples can get married…
Civil Partnership Dissolutions
At first glance, these seem to have rise to quite a high number – in 2018 there were almost as many dissolutions as there were newly formed civil partnerships!
NB Women are more likely to dissolve than men, even though they are less likely to form a civil partnership in the first place. In fact, 80
The median duration of marriage for same-sex couples who divorced in 2018 was 3.9 years for men and 3.5 years for women. (ONS, Divorces in England and Wales 2018). 80% of divorces are to female couples!
NB there is currently very little data to go on for same sex divorces, as there are so few marriages!
Since the 1960s marriage rates are down, and cohabitation and divorce rates are up!
This post explores the long and short term trends in marriage, divorce and cohabitation in the United Kingdom.
Marriage, Divorce and Cohabitation: Key Facts
There are approximately 230 000 marriages a year in England and Wales. This is down from just over 400 000 a year in the late 1980s.
The marriage rate halved between 1991 and 2019. For women the rate declined from 34/1000 in 2019 to just 18/ 1000 in 2019.
The average age for marriage is 34 for men and 32 for women. The average age of marriage is getting older. In 1967 the average ages were 27 for men and 25 for women.
The number of church weddings is declining. Only 18.2% of weddings were church ceremonies in 2019.
The number of cohabiting couples is increasing. In 2022 18.4% of families were cohabiting. This is up from 15.7% of families in 2012.
There has been a long term increase in the divorce rate since the 1950s. However the divorce rate declined between the early 2000s and 2018. More recently it has been increasing again.
In 2022 there were 9 divorces per 1000 marriages. There were a total of 113 500 divorces in 2021.
Where possible I have included data from the latest Office for National Statistics (ONS) publications on marriage, cohabitation and divorce from 2023. However sometimes I have used previous publications because those show longer term trends or analyse the data in different ways.
Marriage Statistics
There was a long term decrease in the number of marriages per year since the late 1960s when there were just over 400 000 marriages every year, until around 2008, when the number hit around 230 000.
There has been a slight increase since then and there are now around 240 000 marriages every year in the UK, and this number has been relatively stable since 2008.
Marriage Rates in England and Wales
The marriage rate is the number of people who get married per thousand unmarried people. The marriage rate is slightly higher for men than for women, although the difference has decreased over the last 30 years (1).
The marriage rates in England and Wales almost halved between 1991 and 2019 for both men and women.
In 1991 the marriage rate for men was 39/1000, this had declined to 20/1000 by 2019.
For women the figures were 34/1000 and 18/1000 respectively.
During the lockdown of 2020 the marriage rate plummeted to only 6/1000 for both men and women.
I would expect the marriage rate to be similarly low in 2021, but then to increase in 2022 and maybe even 2023 with people having delayed getting married increasing the numbers. I think we will have to wait until 2024 for marriage rates to get back to normal and be able to compare the long term trend.
What is the average age of Marriage?
In 2019 the average age of marriage for men was 34.3 years for men and 32.3 years for women (2).
Looking at the longer term trend the average age of marriage has increased by almost ten years since the the 1960s.
In 1967 the average age of marriage was 27 for men and 25 for women.
The 2019 ONS data also shows us recent trends in the ages of same sex married couples getting married. Same-sex couples get married slightly older compared to opposite sex couples.
The Decline of Church Weddings
The above chart shows the drastic decrease in religious marriages, down to only 18.2% of all marriages by 2019. 82.8% of marriages in 2019 were civil ceremonies.
90% of couples cohabited before marrying in 2017, up from 70% in the late 1990s.
Limitations with Marriage Statistics
The ONS only publishes annual marriage statistics three years after the year marriages took place. This is because there can be a delay of up to 26 months from clergy and other official bodies in recording the marriages. The ONS estimates that one year on from marriages taking place, around 4% of them have still not been recorded. The three year delay is to make sure data recording is accurate.
Cohabitation Statistics
The proportion of cohabiting households in England and Wales has increased in the last decade.
18.4% of families were cohabiting in 2022. This is an increase from 15.7% of families in 2012.
Younger couples are much more likely to cohabit
According to UK Census, in 2021 (5)
89% of couples aged 20-24 were cohabiting.
45% of couples aged 30-34 were cohabiting.
24% of couples aged 40-44 were cohabiting.
This declines to less than 10% for all couples aged 65 and over.
All aged groups were more likely to cohabit in 2021 compared to 2011, except for the very oldest age category of 85s and over.
Divorce Statistics
Since the 1960s there has been a long term increase in the divorce rate.
The number of Divorces per year increased rapidly following the Divorce Reform Act of 1969, and then increased steadily until the early 1980s. In the late 1950s, there were only around 20 000 Divorces per year, by the early 1980s this figure had risen to 160 000 per year (quite an increase!)
It then stabilised for about 10 years and then started to decline in 2003, the number of divorces per year is still in decline. There are currently just under 90 000 divorces per year in England and Wales.
The Divorce Rate
The Divorce Rate was extremely low in the late 1950s, at only 2.5 per 100 000 married couples (3)
The Divorce Reform Act of 1969 led to this increasing rapidly to 10 per thousand in just a few years, by the early 1970s.
The Divorce Rate continued to increase until the early 1990s, when it hit almost 15 per thousand married couples. Since then it has been falling and currently stands at 7.5
The divorce rate has fallen since 2004
The divorce rate has fallen overall since 2004, but increased in recent years.
From 2004 to 2018 the UK divorce rate fell from 13 per 1000 marriages to just above 7 per 1000 marriages, the low point since before the 1969 Divorce Act.
The divorce rate has increased slightly since 2018, but only slightly and is currently at 9 divorces per 1000 in 2022.
The total number of divorces in 2021 was 113, 505.
What percent of marriages end in divorce?
The percentage of marriages which end in divorce depends on the year in which the marriage took place.
For those married in 1965, 28.7% of marriages had ended in divorce after 35 years.
For those married in 1975, 37.6% of marriages had ended in divorce after 35 years.
For those married in 1985 43.4% of marriages had ended in divorce after 35 years.
For those married in 1995 41.7% of marriages had ended in divorce after 25 years, and the divorce rate looks set to be higher by 35 years.
Those married in 2005 and 2015 have lower divorce rates for younger marriages, so are set to have divorce rates after 35 years somewhere between 36% and 42%.
For those who got married in 2005, 20.7% had got divorced after 10 years and 29.2% after 15 years.
How long does the average marriage last?
The length of marriage is increasing. For marriages which end in divorce, the median length of a marriage was 12.3 years.
For same sex couples the median length of marriage is much shorter. It is 5.9 years for male couples and 5.3 years for female couples.
Opposite and Same-Sex Divorces
There were 111. 934 opposite-sex resources in 2021, 63% of which were petitioned by females and 37% petitioned by men.
There were 1571 same-sex divorces, of which 67% were petitioned by female couples. The number of same-sex divorces has increased every year since they first became possible in 2015, following the introduction of same-sex marriage shortly before.
Limitations with divorce statistics
Divorce statistics only show marriage break ups which are final. They don’t show married couples who are separated.
There are no formal official break up statistics for cohabiting couples. Hence it’s difficult to compare break up rates for married and cohabiting couples.
It is difficult to compare the rates of divorce between same-sex and opposite-sex couples. Same sex marriage has only been around for less than a decade, and most divorces happen after several years of marriage. We will have to wait a few more years at least to be able to make valid comparisons.
Careful with comparisons! The Divorce Rate shows a slightly different trend to the ‘number of divorces’. The former is relative to the number of married couples!
Main sources used to write this post
(1) Office for National Statistics (May 2023): Marriages in England and Wales 2020.
Office for National Statistics: Divorces in England and Wales 2018.
ONS: Marriages in England and Wales 2017.
ONS: Marriage and Divorce on the Rise, Over 65 and Over.
Signposting
This post is relevant to the ‘marriage and divorce’ topic which is usually taught as the second topic within the AQA’s families and households A-level sociology specification.
The 1969 Divorce Act, more women in paid work and the decline of tradition and more individual freedom can help explain the long term increase in divorce.
There has been a long term increase in divorce in England and Wales since the 1950s, despite a more recent decline.
The Divorce rate was 2.5 per 1000 marriages in the 1950s, gradually increased to 4 per thousand through the 1960s and then rapidly increased to 10 per thousand by the mid 1970s.
The Divorce rate then carried on rising steadily to reach a peak of 14 per thousand by the mid 1990s, and then started to decline slowly to its current level of 7.5 divorces per thousand marriages.
This post looks at the reasons for the long term increase from the 1960s to the 1990s especially. NB despite the recent decline we still have a divorce rate today that is three times greater than it was in the 1960s, so there has still been a long term increase in the divorce rate overall.
Why has there been a long-term increase in divorce?
There are four main factors which can explain the long term increase in divorce since the 1960s:
Social policy changes, mainly the Divorce Act of 1969.
Economic factors such as the rising cost of living.
Changing gender roles such as more women going in paid-work
Postmodernsisation which has meant the decline of religion and more freedom of choice.
This post examines these factors and others.
Social Policy Changes
The Divorce Act of 1969 explains the rapid increase in divorce during the early 1970s.
Prior to the Divorce Act it had been difficult to get a divorce because one person had to be at fault and accept blame for the marriage breaking down, through for example having had an affair.
The 1969 the Divorce Act extended the grounds of divorce to ‘irretrievable breakdown’, meaning that two people could simply agree that the marriage wasn’t working for them because they had just fallen out of love and that it was no one persons fault.
The Act was passed by parliament in 1969 and came law in 1971. Married couples could get divorced after two years if both agreed and after five years if only one person wanted a divorce.
However, this cannot explain all the increase because the divorce rate was rising before the act, and continued to rise for many years after its immediate impact in the very early 1970s.
It seems fair to say there were deeper, underlying social factors which created the conditions for higher divorce and the policy change reflected these changes.
Economic Factors
Increasing inequality in the UK has meant that the lower social classes now get paid less compared to rising living costs (mortgages/ bills). This means that both partners in a marriage now need to do paid work to get by, which puts a strain on the marriage which leads to higher numbers getting divorced.
A positive evaluation of this is that divorce rates are higher amongst poorer families.
A negative evaluation is that there isn’t a perfect correlation between increasing costs of living and the divorce rate: the divorce rate has been going down since 2010 when costs of living have been increasing.
Feminism/ changing gender roles
The changing position of women in society. Is crucial to understanding the increase in divorce rates.
The proportion of women staying on in higher education and entering paid work, especially professional occupations, steadily increased during the 1970s and especially the 1980s and early 1990s.
The proportion of women in some kind of paid work is now 70%, whereas in the 1950s it was less than 50%.
This means the ‘normal’ type of household is a dual-earner household in which both men and women are doing paid-work, which means men and women are on a more equal footing in their domestic relationship with women no longer being financially dependent on a male breadwinner.
Financial independence makes getting a divorce easier, and 70% of divorces are filed by women so this certainly explains some of the increase.
It also means that women spend longer building their careers before they have children, and so there are more childless married couples in their mid to late 30s, which makes getting a divorce much easier.
Anthony Giddens argues that two things lie behind the above changes to gender roles:
the impact of the Feminist movement, which has campaigned for equality of opportunity for women in society.
advances in contraception which allow women to avoid unwanted pregnancies.
Feminists however, point out that the advances of women can be exaggerated – women still earn less than men, and traditional gender norms remain in many families.
Postmodernism
Both religion and traditional values have declined in Britain. As a result there is no longer a set of social values which force people into staying married, there is less social stigma attached to getting a divorce and so people are freer to choose to get divorced. This change reflects the declining importance of social structure and the rise of consumer culture – the idea that individuals can choose their own lifestyles.
Giddens (1992) believes that the nature of marriage has changed because the nature of intimate relationships more generally have changed:
In the early period of modernity in the late 18th century, marriage became more than an economic arrangement as the idea of romantic love developed. The marriage partner was idealised as someone who would perfect a person’s life. Women kept their virginity waiting for the perfect partner.
In the era of what Giddens calls ‘late modernity’, plastic sexuality has developed. This means that sex can be for pleasure rather than conceiving children with your perfect marriage partner. Relationships and marriages are no longer seen as necessarily being permanent.
Marriage is now based on confluent love – Love that is dependent upon partners benefitting from the relationship. If they are not fulfilled in their relationship, couples no longer stay together out of a sense of duty, so divorce and relationship breakdown become more common.
Ulrich Beck points out that divorce has increased because individualisation. This involves:
More opportunities for individuals, especially women, and the opportunity for individuals to take more decisions about every aspect of their lives.
Increased conflict emerging from increased choice and uncertainty which leads to chaotic relationships and helps explain the higher divorce rate.
Functionalism
There are a number of reasons linked to the Functional Fit Theory which could explain the increase in divorce:
Functionalists such as Goode (1971) believe that conflict has increased because the family has become more isolated from other kin, placing an increased burden on husbands and wives who have little support from other relatives.
Dennis (1975) believes that because the family performs fewer functions the bonds between husband and wife are weaker.
Allan and Crowe (2001) point out that because the family is no longer an economic unit, this makes it easier for families to break up.
The New Right
The New Right would claim that increasingly generous welfare benefits for single mothers is a crucial factor which allows women to divorce if they deem it necessary.
If divorce occurs within a family, the child will go with the mother in 90% of cases making it difficult to find full time work: and hence benefits may be a necessary link in the chain of explaining the increase in divorce.
The New Right would also see the increasing divorce rate as a sign of wider moral decline.
Signposting and related posts
This is one of the main topics within the families and households module commonly taught in the first year of A-level sociology.
Emma Watson recently coined the term ‘self-partnering’ to demonstrate her happiness with being single, which is in an increasing trend in the UK
There are 16.7 million people in the UK who are single and never married, and the number is increasing, with almost 370 000 more single people in the UK in 2018 compared to 2017, according to the Office for National Statistics.
Unsurprisingly, you’re more likely to be single and never married when you’re younger compared to when you’re older, but at Emma Watson’s age almost half of people are single. However this has declined to only 25% of the population for people in their mid 40s.
NB – being single and not married doesn’t necessarily mean you’re lonely or celibate: many of these people will be dating, maybe in the early stages of a relationship, maybe in a more serious relationship and just not living together, so this just their formal status, rather than their actual relationship situation.
It would be interesting to get some stats on how many of these people are actually ‘single’ in the sense of not being in any kind of romantic relationship!
Relevance of this to A-level sociology
This is just a quick update to highlight the continued trend away from marriage and towards singledom. This is relevant to the ‘marriage and divorce’ topics and the ‘decline in the family’ debate within families and households.
If you’re interested in understanding why there are more single people, this post is a good starting point, on the increase in single person households, a closely related topic!
You can also use the ‘definition’ of single by the ONS to illustrate some of the limitations of official statistics – in that it isn’t the same as how most of us would use the word ‘single’ when we talk about relationships.
Summary revision notes (in diagram form) on sociological perspectives applied to the decline of marriage in society, written to help students revise for the families and households section of the AQA’s A-level sociology paper 2: topics in sociology.
You will probably need to click to enlarge/ save the picture below!
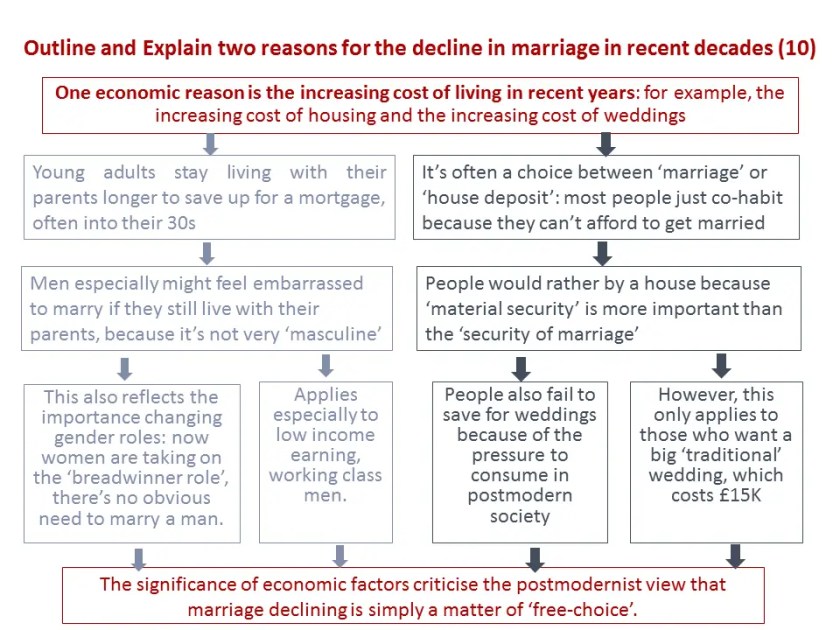
A model answer for a 10 mark ‘outline and explain’ question on the AQA’s A level sociology paper 2 (families and households)
A model answer to a possible 10 mark ‘outline and explain’ question, written for the A-level sociology AQA A-level paper 7192/2: topics within sociology: families and households section).
Question
Outline and explain two social changes which may explain the decline of marriage in recent decades (10)
Model Answer
The first social factor is in more depth than the second.
Economic changes such as the increasing cost of housing and the increasing cost of weddings may explain the decline of marriage:
Young adults stay living with their parents longer to save up for a mortgage, often into their 30s. Men especially might feel embarrassed to marry if they still live with their parents, because it’s not very ‘masculine’. This also reflects the importance changing gender roles: now women are taking on the ‘breadwinner role’, there’s no obvious need to marry a man. This applies especially to low income earning, working class men.
Furthermore, it’s often a choice between ‘marriage’ or ‘house deposit’: most people just co-habit because they can’t afford to get married. People would rather by a house because ‘material security’ is more important than the ‘security of marriage’. People also fail to save for weddings because of the pressure to consume in postmodern society. However, this only applies to those who want a big ‘traditional’ wedding, which costs £15K.
The significance of economic factors criticise the postmodernist view that marriage declining is simply a matter of ‘free-choice’.
A Second reason for the decline of marriage is secularisation, or the decline of religion in society.
Christianity, for example emphasises that marriage is a sacred union for life before God, and that sex should only take place within marriage. With the decline of religion, social values have shifted so that it is now acceptable to have sex before marriage, and with more than one partner, meaning that dating, serial monogamy and cohabitation have all replaced marriage to a large extent.
The decline of religion also reflects the fact that marriage today is not about ‘pleasing society’, it is simply about pleasing the two individuals within the relationship, the ‘pure relationship’ is now the norm, and people no longer feel like they need God’s approval of their relationshp, so there is less social pressure to get married.
However, this trend does vary by ethnicity, and Muslims, Hindus and Jews within Britain are all much more likely to get married in a religious ceremony.
An Overview of Families and Households Topic Two – Marriage, Divorce and Cohabitation, covering key sub-topics, key concepts and some exam style questions (short answer and essay questions).
You need to be able to identify key trends in marriage, divorce and cohabitation and outline the social factors which explain why the trends are happening (ideally using sociological perspectives), and analyse the importance of each factor. You also need to be able to outline different perspectives views on the consequences of the changing patterns of each of the above.
Sub topics
2.1: Explaining the trends in marriage
2.2: Explaining the trends in divorce
2.3: Perspectives on the consequences of declining marriage and increasing divorce
2.4: Examining how marriage, divorce and cohabitation vary by social class, ethnicity, sexuality and across generations
Key concepts, research studies and case studies you should be able to apply
Civil Partnerships
Divorce
Legal separation
Empty shell marriage
Secularisation
Cohabitation
The pure relationship (Anthony Giddens)
The negotiated family (Ulrich Beck)
Consumer culture
Postmodernisation
Gender roles (changing)
Genderquake
Individualisation
Monogamy
Serial Monogamy
Possible exam style short answer questions
Outline three reasons for the overall rise in the divorce rate since 1969 (6)
Using one example briefly explain one reason for the recent decrease in divorce rates (4)
Outline three social changes which explain why there has been a decline in the marriage rate (6)
Outline and explain two consequences of an increasing divorce rate (10) hint – use the perspectives.
Define the following terms – the matrifocal family, polygamy, polygyny and polyandry (4*2 marks for each term).
Possible Essay Questions – You should plan these!
Assess sociological explanations for the changes in the patterns of marriage and cohabitation over the last 40 years or so (20)
Assess sociological explanations for changes in the divorce rate since 1969 (20)
Assess different perspectives on declining marriage, increasing divorce and increasing co-habitation (20)
Asian households are the most likely to married, black households have the highest rates of single parents.
This brief update explores the extent to which family life and attitudes to family-life vary across some of the different ethnic groups in the UK. It looks at such things as marriage, divorce, birth rates, household types, equality and household structure.
Ethnicity data from the 2021 UK census shows that 81.7% of the UK population are classified as ‘white’, 9.3% as ‘Asian’ or ‘Asian-British’, 4% as’ Black’, 2.9% as ‘Mixed’ and 2.3% as ‘other’.
(NB – This represents a significant increase in ethnic minorities compared to the 2001 census. In 2021, 18% of the population were non-white, compared to 9% in 2001.)
To generalise, Asian adults are about 2.5 times more likely to be married than Black adults, and half as likely to be divorced (1)
Pakistani, Indian and Bangladeshis have the highest rates of marriage and Black Caribbean the lowest… Over 60% of Asian adults are married compared to only 25.5% of Black Caribbeans.
Conversely, Mixed White/ Black, mixed White/ Asian and Caribbeans have the highest ‘divorced’ rate, at over 10%, while Indian, Pakistani and Bangladeshis have much lower divorce rates, all below 5%.
Divorce has traditionally been seen as something shameful in Asian culture, with children under pressure to stay in loveless marriages in order to uphold the family’s honour and prevent shame falling on the family.
However, for today’s third and fourth generation Asians, things are much different.. According to this article there is a soaring British Asian divorce rate now that young Asian men and especially women are better educated and increasingly going into professional careers.
Household type by Ethnicity
Some of the most obvious differences of ethnic minority households (compared to white) households include:
Asian households are three times less likely to be cohabiting, and have higher rates of marriage
Asian households have half the rate of Lone Person households compared to white households.
Black and mixed households have twice the rate of lone parent households.
Black, Asian and mixed households have incredibly low levels of pensioner couple households compared to White households, and much higher rates of ‘other households’ (could be ‘multigenerational?)
Household types by ethnicity, UK Census 2011
To be more specific:
47% of Asian households are married compared to just 22% of Black households and 33% of White households.
Asian households have very low rates of cohabitation at only 3.5%, half that of Black households (7%) and three times less than White households (10%)
24% of black households are lone parent, compared to only 10% of White households and 8% of Asian households.
32% and 31% of Black and White households respectively are single person households, but only 17% of Asian households.
Married
Cohabiting
Lone Parent
One person
Asian
47%
3.50%
9%
17%
Black
22%
7.00%
24%
32%
White
33%
10%
10%
31%
Source here. British Asians have more conservative views towards marriage and sexuality
According to a poll in 2018, British Asians are twice as likely to report that ‘sex before marriage’ is unacceptable than ‘all Britons’, they are also more likely to be against same-sex relationships.
A previous UK National Statistics report showed that the highest proportions of married couples under pension age, with or without children, are in Asian households. Over half of Bangladeshi (54%), Indian (53%) and Pakistani (51%) households contained a married couple, compared with 37% of those headed by a White British person. Demonstrating the importance of marriage for the Brit-Asian communities.
Forced Marriages are more common among Asian Families
There is also a dark-side to Asian family life, and that comes in the number of Forced Marriages associated with Asian communities.
In 2018 the British authorities dealt with 1500 cases of Forced Marriage, with there being over 1000 cases a year for most of the last decade.
Nearly half of all cases involve victims being taken to or originating from Pakistan, with Bangladesh being the second most involved country.
Only 7% of Forced Marriages take place entirely in the UK, so there’s an interesting link to (negative) Globalisation and family life here.
In 2021 the Total Fertility Rate for UK born women was 1.5 compared to 2 for non-UK women. This means the birth rate for non-UK born mother is about 25% higher.
The percentage of babies born to women from outside the UK has increased considerably over the last 20 years, but has recently leveled off and could now be declining.
Around 28% of births are to women who were born outside of the UK in 2018.
The number of interracial relationships is increasing
The fact that interracial relationships are increasing might make it more difficult to make generalisations between ethnic groups in the future…..
Overall almost one in 10 people living in Britain is married to or living with someone from outside their own ethnic group, the analysis from the Office for National Statistics shows.
But the overall figure conceals wide variations. Only one in 25 white people have settled down with someone from outside their own racial background. By contrast 85 per cent of people from mixed-race families have themselves set up home with someone from another group.
Age is the crucial factor with those in their 20s and 30s more than twice as likely to be living with someone from another background as those over 65, reflecting a less rigid approach to identity over time.
A brief history of South-Asian Family Life in the UK
This historical study by Ballard (1982) noted that most South-Asian families had a much broader network of familial-relations than a typical white-British family and one individual household might be only one small part of a complex global network of kin-relations.
Ballard argued that in order to understand South-Asian family life in the UK in the 1980s, you had to look at the ideal model of family life in Asia which is Patriarchal, being based on tight control of women, collectivist (the group is more important than the individual) and obsessed with maintaining family honour (primarily through not getting divorced/ committing adultery or having children outside of wedlock) because maintaining honour was crucial to your being able to do business in the wider community.
Ballard also stressed the importance of Honour and its Patriarchal nature….. The complexity of the question of the asymmetry of the sexes is nowhere better illustrated than in the concepts of honour, izzat and shame, sharm. In its narrower sense izzat is a matter of male pride. Honourable men are expected to present an image of fearlessness and independence to the outside world, and at the same time to keep close control over the female members of their families. For a woman to challenge her husband’s or her father’s authority in public shamefully punctures his honour. To sustain male izzat wives, sisters and daughters must be seen to behave with seemly modesty, secluding themselves from the world of men.
One of the key questions A-level sociology students should ask themselves is the extent to which the above research is true today, or the extent to which things have changed!