Last Updated on July 5, 2023 by Karl Thompson
How do aspects of family life such as marriage, divorce, cohabitation, birth and death rates vary by social class?
This post has been written to fit the A-level sociology specification, families and households topic.
While social class and income levels are not the same thing, I’ve had to use Income as a ‘proxy’ for social class given that the research tends to look at family variation by income or level of education rather than class more generally.
Marriage, divorce and social class
If we take level of education as a proxy for social class, then then middle class couples are more likely to get married than working class couples. (1)

50% of adults aged over 16 with level four qualifications were married, compared to only 40% of adults with no qualifications.
The divorce rates are more equal across educational levels, but those with level 4 education have slightly lower divorce rates than other education levels.
Those with lower levels of education are more likely to be ‘separated but not divorced’.
More educated women have fewer babies
If we take educational level of parents as a proxy for the educational level of their female children then more educated women have fewer babies and have them later. (2)
Women with more educated parents have children later in life and have fewer children.
Women with parents who have higher levels of education achievement are less likely to have children by the age 30:
The study split women into two groups: those with parents with ‘low’ and ‘high’ levels of education.
In 2017-20, 52% of women in the low education parents group had children by the age of 30 compared to only 39% of women in the high education group.
The difference between these two groups had widened since 2010-12, when 60% of low-education women had children by age 30, compared to 50% of high education women.
NB the birth rates for women of all ‘social classes’ declined between 2010-12 and 2017-20.
Historical data
The above findings are supported by ONS research from 2014 professional women have long tended to have babies later than ‘working class’ women.
Only 3% of births to women under 30s are to women in higher managerial or professional classifications, but this figure rises to 14% for women over 40.
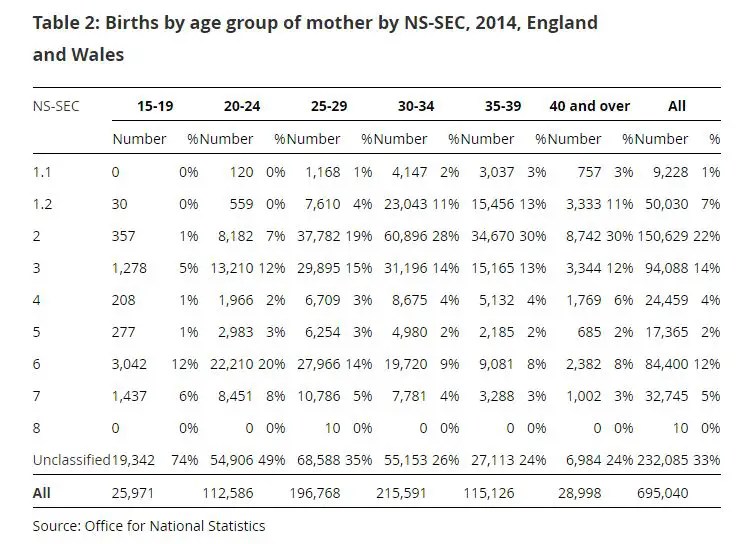
NB – the above doesn’t factor in how many women are in each category of social class, I include that table below…

So it’s difficult to tell from the above! But it does seem that the higher up the social class scale you go, the later in life women have babies!
Previous research from the University of Southampton found that half of women born in 1958 who obtained no educational qualifications had a child by the age of 22, while for those with degrees the age was 32.
This means that the term ‘generation’ could actually mean different things to different classes.
Source: Daily Mail Article from 2012.
Teen Pregnancies and social class
Poor teens are much more likely to get pregnant and have babies than rich teens
According to The Poverty Site, teenage motherhood is eight times as common amongst those from manual social background as for those from managerial and professional backgrounds.
Also, the underage conception rate is highest in the North East of England. Its rate of 11 per 1,000 girls aged 13 to 15 compares to 6 per 1,000 in the region with the lowest rate.
Variations in ‘Life Paths’ by Social Class (American focus)
Research published in 2017 by Opportunity America shows considerable variation in marriage and divorce rates, and ‘life paths’ by social class.
The research divides ‘social classes’ by ‘poor’ ‘working class’ and ‘middle class’ and shows that:
- 56% of people aged between 18-55% in the Middle and Upper classes were currently married, compared to only 26% of those who were ‘poor’.
- Despite having lower marriage rates, the ‘poor’ also had higher divorce rates: 46% of ‘poor’ 18-55 year olds had ‘ever been divorced’ compared to only 30% of middle-upper classes.
- The fertility rates also vary, being 2.4 and 1.7 respectively for the above two groups.
- The Life Paths also vary, as below:

NB I quite like the above chart, it’s go a hint of the personal life perspective, life-course analysis about it!
Questions to consider
- The final piece of research is from America, to what extent would you expect to find similar variations in family life by social class in the UK?
- Give the lack of contemporary data, how might you track the relationship between social class and family life more accurately?
Thoughts and comments
There is only limited data available on the relationship between social class and family life – so much so that you often have to go back almost a decade to find the latest research. It’s very much a gap in official statistics!
Using ‘Income’ data rather than class data is a limitation of the research, the same limitation as when using Free School Meal data as a proxy for social class in the differential educational achievement debate.
Sometimes it is even impossible to find data on the relationship between income and family life – for example, there are no official statistics collected on the relationship between income and divorce, according to this response to a question from the ONS.
Sources and Signposting
This material is mainly relevant to the families and households module, normally taught in the first year of A-level sociology.
(1) Marriage and Civil Partnership Status in England and Wales, UK Census 2021.
(2) Ermisch, J (2022) The recent decline in period fertility in England and Wales: Differences associated with family background and intergenerational educational mobility