The wealth of billionaires in Britain has increased by 1100% in the 32 years between 1990 and 2022.
In 1990 there were 15 billionaires who controlled £53.9 billion in wealth.
By 2022 there were 177 billionaires who controlled £653.1 in wealth.
These increases reflect a wider increase in inequality in the UK more generally. However the increase in wealth at the very top, such as billionaires, has been the most extreme.
Most of the increase has been driven by an increase in the number of billionaires, but there has also been a concentration at the very top. The top two billionaire households in 2022 controlled as much wealth as the bottom half of billionaire households in 1990.
Billionaire wealth has increased due to the structure of the UK economy. It has continued to increase post-Covid despite the wider population facing economic crises.
Billionaires are not uniquely hard working, or intelligent, or creative. Instead, billionaires are better seen as the primary beneficiaries of an economic system which produces huge levels of poverty and inequality, and has left the UK particularly vulnerable to the multiple, overlapping crises we have faced over the past few years.
This blog post is a summary of ‘Billionaire Britain’, a report from the Equality Trust.
Measuring Billionaire Wealth
There is no quality data source on wealth in the UK at the national level. This is because there is no systematic recording of wealth when it is taxed. The Wealth and Assets survey suffers under-reporting from the very wealthiest households. The Times Richlist is the most comprehensive source, but this could miss out on various assets and under-report wealth.
Billionaire Britain uses data from the Times Rich List.
From a research methods perspective this is an interesting example of how power shapes data collection. The very richest are the most powerful and the UK government doesn’t systematically track data on their wealth. In fact, tracking is poor that Billionaire Britain estimates at least £4.4 billion of property investment in the UK has been bought by corrupt individuals.
Why are there more billionaires in Britain?
Two underlying structural changes have enabled massive accumulation by those at the top:
Firstly, the financialisation of the UK means that those with wealth now have greater returns on their investments. This is due to corporations focusing on profits over wages and the inflation of asset prices.
Secondly, deregulation has resulted in less restrictions and fewer taxes on wealth. This has attracted more wealth to the UK.
Of the 177 on the 2022 billionaire rich list 42 gained their wealth through investing and 39 through real estate.
Financialisation is where the financial industry becomes more important to the economy as a whole.
The finance sector consists of a range of different industries from investment companies (including real estate investments), stocks and shares funds, hedge funds, and insurance and pensions.
In a primarily finance based economy, the production of tangible products is less important, and many of the financial services seek to make returns trading financial instruments without creating anything of any value.
One consequence of a financialized economy is asset price inflation. Financial companies invest in assets such as houses and land for a return (rather than seeking to develop land or improve houses themselves) which pushes the prices up.
A second and related consequence is more households taking on debt. This is increasingly required to buy more expensive assets, such as housing.
A third consequence is more companies seeking profit over wages and quality services. They become more concerned with providing dividends to shareholders over paying decent wages.
In terms of service provision, energy and water companies have extracted billions in profits over the last years. Shareholders have got richer as a result. However the infrastructure is now crumbling in many cases, as evidenced with things such as leaky water pipes.
All of the above has resulted in a more unequal society as a few benefit from financialisation. Meanwhile at the bottom end people have relatively less money AND worse services.
What are the solutions to increased wealth and the inequality this causes?
The Equality Trust suggests five courses of action…
Introduce a progressive wealth tax. That means the wealthier you are the more tax you pay!
Make corporate ownership more democratic, so more people have a say in what happens to profits.
Regulate the financial sector more.
Return essential services to public ownership.
Improve tax transparency and end tax havens.
Create more community wealth funds to invest in areas that need it most.
Wealth distribution in the UK is shockingly unequal, especially if we take into account the wealth of the top 1%.
For 2018-2022 the distribution of wealth according to ONS data (1) was as below:
Or in table form:
Decile
Total Household Wealth
Top 1%
£4,403,500
10th (Highest) wealth decile
£1,941,300
9th wealth decile
£1,031,200
8th wealth decile
£685,500
7th wealth decile
£470,300
6th wealth decile
£339,600
5th wealth decile
£222,200
4th wealth decile
£129,200
3rd wealth decile
£47,300
2nd wealth decile
£23,000
1st (Lowest) wealth decile
£8,000
The extreme difference between the top 1% and the bottom deciles is stark. The top 1% have average wealth of over £4 Million, the bottom 10% only £8000 on average. (This is median household data).
This means the wealthiest 1% of households are 550 times richer than the bottom 10%.
The potential benefits of wealth redistribution
According to the Joseph Rowntree Foundation just over 20% of households were in poverty in 2020/21. 8% of these households are in very deep poverty (2)
To round things up let’s think about increasing the wealth of the bottom 10%.
Redistributing just 50% of wealth away from the top 1% could do amazing social good. If you did this then each of the 2.3 Million households in the bottom 10% would receive around £22 000 each.
£22 000 per household for the bottom 10% of households could contribute towards:
better insulation or damp proofing. The poorest households tend to be those in the worst conditions.
An education or training fund for one or more household members.
Small business start up costs.
Medical fees as appropriate
debt clearance, to help prevent the debt-cycle.
There is no way the top 1% are 550 times more hardworking or talented than the bottom 10%. This will be wealth unfairly accumulated due to previous generations having had wealth.
Thus there is no moral argument against taking all of this unearned wealth away, let alone just half of it!
NB we could have exceptions for the working class roots self-made millionaires. There will be a few thousand of these no doubt!
good resources for teaching wealth, poverty, income inequality and social class. Useful further reading for students studying A-level sociology!
Here you will find links to some contemporary sources for further reading organised into the following categories
Annually published statistics and reports
News articles from the last five years (often based on the above)
Videos and Documentary resources
Committed organisations dedicated to studying this specific topic.
I will endeavour to update this list at least every three years, but with so much material already on ReviseSociology.com this might be a challenge!
These resources are intended for students studying an introduction to A-level Sociology – for the main blog posts introducing the topic of social class and inequalities please see the relevant links on the introduction to sociology page.
Annual research studies on income and wealth inequalities in the UK
The Heat or Eat Diaries from The Guardian – a varied series written from a mixture of people living in poverty, academics and journalists.
Working class people feel like they ‘don’t’ fit in’ to middle class working cultures – An excellent article from The Conversation based on research into how middle class cultural capital makes working class people feel like they don’t belong in middle class jobs – because of cultural differences rather than their ability.
The Made in Britain Series from The Guardian gives video cameras to those who are themselves living with the cost of living crises and supports them to make videos of their own lives. I’m not sure what research method you could call this – video diaries I guess, with technological assistance from professional film editors?!?
Panorama – Surviving the Cost of Living Crisis (2022)
Why are so many people living in Poverty? News Night (2021)
How does student debt affect life-chances? – Links to education and social class inequalities – and yes, as you may have thought, being in debt because of having to pay fees does have a detrimental affect on your future life-chances.
The Equality Trust – focussing on research on the harmful effects of social inequality on societies and individuals
The Social Mobility Commission – a government funded (but ‘independent’) organisation which monitors social progress (or lack of it) towards (or away from) social mobility.
Global inequality is one of the core themes in the Global Development option within A-level sociology, and visual infographics are a useful way of making global inequalities easier to understand.
This post focuses on global wealth inequalities.
Details of how wealth is measured are included at the bottom of this post.
(This was almost 9% increase on the previous year, and continued a long term trend of increasing wealth over the last two decades.)
If this wealth were distributed evenly, each individual adult in the world would have a total net worth of almost $80 000. However, the distribution is far from equal!
The map below shows the median net private wealth per household in different countries in 2019, according to Credit Suisse.
From the figure we can see that generally:
North America, Western Europe and Australian households have an average wealth of over $100 000.
Brazil, China and Russia (three of the BRIC nations) have an average household wealth of between $25 000 to $100 000
Much of Asia and Latin American and North Africa have an average household wealth of between $5000 to $25 000
Most of Sub Saharan Africa and Afghanistan have an average household wealth of less than $5000.
NB – you can look at practically any map of any development indicator (health/ education/ peacefulness etc.) and you’ll find that poor health, low levels of education and high levels of conflict are correlated with low levels of wealth. There are some notable exceptions, but as a general rule, low levels of household wealth means poor social development!
(For example, one notable exception is the USA which is very wealthy but severely socially underdeveloped, possibly because of such high levels of relative poverty within the country)
Global Wealth by Country
The infographic below by Visual Capitalist (link below) shows us the amount of wealth per country:
Top wealthiest countries
Visual Capitalist also produced the following table:
Rank
Country
Region
Total Wealth ($B, 2019)
% Global Share
#1
United States
North America
$105,990
29.4%
#2
China
China
$63,827
17.7%
#3
Japan
Asia-Pacific
$24,992
6.9%
#4
Germany
Europe
$14,660
4.1%
#5
United Kingdom
Europe
$14,341
4.0%
#6
France
Europe
$13,729
3.8%
#7
India
India
$12,614
3.5%
#8
Italy
Europe
$11,358
3.1%
#9
Canada
North America
$8,573
2.4%
#10
Spain
Europe
$7,772
2.2%
#11
South Korea
Asia-Pacific
$7,302
2.0%
#12
Australia
Asia-Pacific
$7,202
2.0%
#13
Taiwan
Asia-Pacific
$4,062
1.1%
#14
Switzerland
Europe
$3,877
1.1%
#15
Netherlands
Europe
$3,719
1.0%
All Other Countries
$56,585
15.7%
Global Total
$360,603
100.0%
Top 15 wealthiest countries.
The above table is kind of useful, when you see that the USA controls almost a quarter of the world’s wealth, but with only around 4% of the world’s population, that alone can give you a sense of the inequality, especially when it’s leading China in P2 whose population is more than double that of the United States.
NB – What country wealth statistics don’t show is how equally (or unequally in the case of America) wealth is distributed in a country, which is something we will consider later.
The Global Wealth Pyramid
A second visualisation Credit Suisse Produce is the global wealth pyramid
The Global Wealth Pyramid
This pyramid shows us that:
The top 1% of the population, or just 52 million people (those worth more than $1 million) control 43.4% of the world’s wealth
The next 11.4%, or 590 million people (those worth from $100 000 to $1 million) control 40.5% o the world’s wealth
The next 34%, or 1.7 billion people (those worth from $10 000 to $100 000) control 14.7% of the world’s wealth
The poorest 53%, or 2.7 billion people (those worth less than $10 000) control only 1.4% of the world’s wealth.
The richest 1% own 43% of the world’s wealth
The visualisation below (courtesy of the global inequalities blog, link below) does a good of showing how few people control how much wealth, and how many people control so little:
Wealth controlled by Ultra High Net Worth Individuals
The graphic below zooms in closer on the very very wealthy. We see that those worth more than $30 million, just 0.002% of the world’s population control over 7% of the world’s wealth!
Definition of ‘Net Worth’ or Wealth
According to the Global Wealth Report, Net worth, or “wealth,” is the value of financial assets plus real assets (principally housing) owned by households, minus their debts.
This figure includes the net value of all the assets a household owns if sold and their private pension fund assets. The figure does not include any state entitlements/ benefits or state debts.
Discussion Question:
What is the best way to visualise global wealth inequalities?
Sources
Credit Suisse: Global Wealth Report 2020, linked above
Global Inequalities blog – does a nice job visualising some of the stats in the Credit Suisse Report. NB the stats above are from the 2019 report, but that’s not too long ago and I like them!
Visualcapitalist – produced the excellent football like visualisation of wealth inequalities by country!
This post focuses on a recent report produced by Credit Suisse. It is primarily written for students studying the Global Development option for A-level sociology, and is meant to serve as an update on Global inequalities!
In 2019, Privately Owned Global Wealth had grown to $399 trillion, an almost 9% increase on the previous year, according to Credit Suisse’s latest 2020 Global Wealth Report, which focuses on both wealth trends to 2019 and the impacts of Coronavirus on wealth up until June 2020.
That 9% increase from 2018 continued a long term trend of increasing wealth over the last two decades. In the year 2000, global wealth stood at $118 trillion (at current US prices) and has risen on average by 6.6% per annum since then, with a significant decrease (and subsequent recovery) in 2008 with the financial crisis.
NB – wealth is not distributed evenly and the map below shows the median net private wealth per household in different countries in 2019,
The impact of Coronavirus on Global Wealth
The Global Wealth Report notes that to June 2020 Coronavirus has cost the global economy around $8 trillion, in terms of what economic growth was predicted to be.
We see a rapid decline in global wealth per person January to March, when Coronavirus was taking hold, but then a recover, as governments around the world stepped in with stimulus packages.
The chart above also shows you that we’ve basically just had zero growth in wealth since from 2019 to June 2020.
However, you can see that by June 2020 there has been a decline in wealth per person of around $3 000, compared to projected growth which never happened!
The Economic Impact of Coronavrius on Different Regions
The chart below shows the impact by region
The impact of Coronavirus up until June 2020 seems to have been minimal on most regions if we compare the 2019 projections with the actual figures to June 2020.
The global average decline in wealth to June 2020 is – 2%, and most regions have seen around a 2% decline, compared to what was expected, overall we simply have almost 0 global growth compared to an anticipated 2% increase!
There are minor variations across regions, but nothing too significant according to the figures above!
There are significant variations by country
However, if we look at the impact of Coronavirus on wealth by country, we do see significant differences emerging:
The above chart shows us that to June 2020 the UK’s average household wealth declined by 7%, while China’s increased by 4%. Meanwhile the USA has seen almost no change to private household wealth!
This infographic shows the biggest percentage gains and losses per individual by country
We can see some dramatic variation here, with Brazil and South Africa’s per person wealth declining by around 25%, supposedly due to Coronavirus, while quite an eclectic mixture of countries have seen their individual wealth increase by 5%
NB – the figures look more dramatic if you look t the dollar amounts:!
Projections for future wealth growth
The Global Wealth Report is optimistic about future growth potential in most regions, especially India and China
How valid is this data?
NB – this report is latest based on available data, but it was written before the latest wave of lockdowns in November 2020.
The report is very clear that these global wealth trends could change dramatically depending on how Coronavirus and the societal reaction to it develops!
You need to be sceptical I think about the focus of this report – it is on global wealth, rather than global poverty, if you look at the later (poverty not wealth) you realise that there are millions of people around the world who are being pushed into poverty because of Coronavirus (more of that later!) – but you miss out on this in this report because it’s been written mainly (I think) for a Western audience, and you get the impression that’s everything is OK.
This report by Alianz and the World Bank gives you a different impression, talks of a ‘wealth buffer’ which insulates the wealthy from the worst effects of the economic downturn caused by the Pandemic, but it also talks about how millions of those towards the bottom are being pushed into extreme poverty.
You might remember that above the Credit Suisse report shows a negative 2% economic growth rate in Africa, then says nothing else about it – well, that basically means a LOT more people pushed into poverty, which is what the Allianz/ World Bank report focuses on!
Note: Definition of ‘Net Worth’ or Wealth
According to the Global Wealth Report, Net worth, or “wealth,” is the value of financial assets plus real assets (principally housing) owned by households, minus their debts. This figure includes the net value of all the assets a household owns if sold and their private pension fund assets. The figure does not include any state entitlements/ benefits or state debts.
If that wealth average wealth were distributed equally then every adult would have around $77 000. H
In 2019, Privately Owned Global Wealth had grown to $399 trillion, an almost 9% increase on the previous year, and continuing a long term trend of increasing wealth over the last two decades.
The Island of Nevis is the most secretive tax haven in the world. Nevis is a solitary volcano in the Caribbean, with a population of just 11, 000, notorious for its involvement in Britain’s biggest ever tax fraud, as well as having been implicated in many other sordid financial scams of modern times, such as when 620, 000 Americans were fleeced out of $220 million in a pay-day loan scam.
Despite its tiny population, Nevis is also home to six domestic banks, one international bank, 18 insurance managers, and dozens of registered law firms. In fact Nevis might well have the highest lawyer to person* ratio on earth.
Nevis is becoming increasingly popular with the world’s rich: since 2012 its financial services sector has grown by a quarter.
Nevis specializes in letting its clients create and register corporations with greater anonymity than almost any other place on planet earth: even the island’s own corporate land registry doesn’t know who owns the corporations registered there.
Companies benefit from further protections: if you suspect a company of having acquired some of its assets illegally, you have to file $100 000 bond with the courts in Nevis before initiating legal proceedings, in order to make sure that no-one makes frivolous claims.
Not that you would have much luck filing a claim against a company registered on the island: Nevis’ regulator holds no information on who owns the companies registered there, or on who owns its companies’ assets.
Then there’s the fact that anyone disclosing financial information without a court order is liable for a $10 000 fine and up to a year in prison. This would serve to put of investigative journalists.
All of this poses a problem for authorities wishing to tackle global crime: if Nevis continues to guarantee anonymity over ownership of assets then there is no way for global crime fighting agencies to trace whether or not those assets have been acquired illegally.
A further problem is that it makes it more difficult for nation states to track down whether large corporations or individuals are dodging their taxes.
Relevance of this case study to A-level sociology
The existence of tax havens demonstrates the absence of global social norms pertaining to tax, and to the relative powerlessness of Nation States to control flows of global capital.
It also suggests support for the Marxist/ World Systems Theory view of globalization. The existence of Tax Havens allows the richest to keep their wealth, perpetuating global inequality. They certainly don’t benefit the global poor!
*some research suggests that ‘lawyer’ and ‘person’ are mutually exclusive categories. Although there’s no actual evidence to back this up.
Sources: The Week July 2018.
This post will also be published to the steem blockchain.
In this Channel 5 series, one family in the ‘wealthiest 10%’ of Britain swap lives for a week with a family in the ‘poorest 10% of Britain’. As I see it this programme performs an ‘ideological control function’ – spreading the myth of meritocracy.
They two families swap houses, budgets and leisure-timetables for a week – in episode two for example, the poor family, living on the rich family’s typical weekly disposable income, have to live off about £3000 per week, while the rich family, have to live off just under £200 per week, and in this episode, both families seem to be genuinely hard working and just, well, nice.
The ‘Poor House’
The meat of the programme consists of watching the families hanging out in their respective houses, doing whatever activities the other family would normally do, and meeting their respective friends/ work colleagues, including some running reflections on how ‘nice’ it is to be rich, and what a ‘struggle’ it is to be poor.
The ‘rich house’
Here’s how the programme performs the function of ideological control – basically it spreads the ‘myth of meritocracy‘.
It misrepresents what the top 10% look like – the narration keeps talking about how the rich family is in the top 10%, they are, but their weekly disposable income of over £3K, and the fact that they own 12 restaurants and employ 60 odd people, puts them easily in the top 1%. This fact alone really annoys me – it is the extreme minority that lives like this. I worked this out using the IFS’ income calculator)
The family in the top 1% are further unrepresentative in that the father genuinely worked his way up after failing school, cleaning toilets and then getting into restauranteering. This is most definitely NOT how the majority get into the top 1%, especially since social mobility has been declining in recent years.
The working class father keeps saying ‘I want my children to see this and want this’ – he seems to take the experience of his week in the rich mans world as evidence that anyone can make it if you try hard enough – in fact there is LESS CHANCE TODAY HIS KIDS than he would have had to climb the career ladder.
Maybe the same point as above – the working class guy has 4 kids – I wonder what the actual chances of all four kids from one working class family independently becoming millionaires actually are? It’s probably lottery odds.
The ‘luck’ word is mentioned once, apparently it’s all about hard work. NO – this view is just plain wrong, Malcome Gladwell convinced me of this in his book ‘Outliers’
Personally I think this series (if it carries on this vein) is lazy and appalling television – it wouldn’t take much to add in some depth analysis, have some commentary or stats overlying how likely it is for someone to go from working class to millionnaire, for example.
The Poor Family – now none the wiser as to how they’ve been shafted by 30 years of neoliberalism
There’s also absolutely no mention of the sheer injustice of the fact that both sets of parents are doing similar amounts of ‘work’ but the rewards are so incredibly different, and no mention of how good it is that we’ve got social housing so at least the poor family have a decent house.
The rich family – nice enough, but so few these days climb the class ladder.
In short, my intense dislike of this show stems from the misleading portrayal of the richest 1% as representing the richest 10% and from its total lack of analysis of the actual chances of social mobility occurring.
NB – It was also quite dull viewing. If you think it sounds a little like Wife Swap, it’s much less entertaining as it’s the whole family doing the swapping, so there’s much less conflict.
Global wealth inequality is increasing, but how can we explain this, is this is a problem, and what could we do to make the world a more equal place?
Trends in Global Wealth Inequality and Poverty
According to the 2016 Global Wealth Report produced by Credit Suisse, wealth inequality in 2016, measured by the share of the wealthiest 1 percent and wealthiest 10 percent of adults, as compared to the rest of the world’s adult population, continues to rise.
While the bottom half collectively own less than 1 percent of total wealth, the wealthiest top 10 percent own 89 percent of all global assets.
NB – You need to look at the pyramid below carefully, what it shows (to compare the very top and bottom) is as follows:
The richest 33 million people (0.7% of the world’s population ) control $116 trillion, or 45.6% of the world’s wealth, or more than $1 million each
The poorest 3.5 billion people (73% of the world’s population) control only $6.1 trillion of wealth, or less than $10, 000 in wealth each.
NB – Inequality is no longer simply a matter of poor people living in less developed countries and rich people living in more developed countries -there are plenty of millionaires in low and middle income countries – the report notes that ‘today, emerging nations are home to 18 percent of the world’s ultra-high net worth population. China alone accounts for 9 percent of the top decile of global wealth holders, which is well above France, Germany, Italy, and the United Kingdom.’
However, this is hardly cause for celebrations, it simply means that not only is global inequality increasing across the world as a whole, but also within most countries in the world – there are billions of poor people living right alongside those millionaires in low income countries!
The infographic below, taken from the World Economic Forum Website (published 2015), displays global wealth inequality more simply, and it’s also easier to remember:the richest 1% control 50% of the world’s wealth, while the poorest 50% control less than 1%.
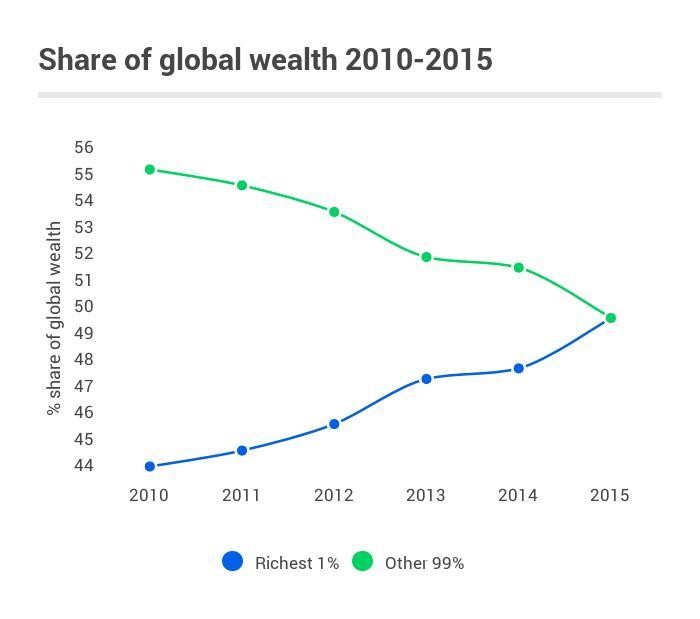
Finally, to turn to trends in inequality over time, the chart below, also taken from the World Economic Forum website, shows how the global share of wealth controlled by the wealthiest 1% has increased from 45% to 50%, while the share of the ‘other 99%’ has decreased from 55% to 50%. (The chart below is derived from Oxfam’s 2016 Report: An Economy for the 1%?)
Oxfam further notes that:
The wealth of the richest 62 people has risen by 45% in the five years since 2010 – that’s an increase of more than half a trillion dollars ($542bn), to $1.76 trillion.
Meanwhile, the wealth of the bottom half fell by just over a trillion dollars in the same period – a drop of 38%.
Since the turn of the century, the poorest half of the world’s population has received just 1% of the total increase in global wealth, while half of that increase has gone to the top 1%
Some Potential Problems with Statistics on Global Wealth Inequalities
Firstly, there are issues with reliability when tracking global inequality – different nations tally income and wealth in different ways, and some nations barely tally reliable stats at all
Secondly, you may have noticed that you get different figures depending on what groups your comparing – things look very different if you compare the top 1% to the rest, rather than comparing the top ten percent to the the bottom ten percent, or the top 50% to the bottom 50%. You might like to think about which is the most ‘valid’ comparison to give you a fair idea of global wealth inequalities (tough question!?)
Why has Wealth Inequality Increased?
What we are asking here, in short form is – how have the rich got so rich, and why have the poor lagged behind? In this section I summarise for changes which are correlated with increasing wealth inequality, all taken from the the Oxfam Report referred to above: Neoliberal economic policy; the global tax haven system, the growth of the financial sector and increasing returns to capital versus labour:
Neoliberal Economic Policy
Neoliberal Economic and policy changes over the past 30 years – including deregulation, privatization, financial secrecy and globalization – have supercharged the ability of the rich and powerful to to further concentrate their wealth.
For example, companies working in oil, gas and other extractive industries are using their economic power in many different ways to secure their dominant position. They lobby to secure government subsidies – tax breaks – to prevent the emergence of green alternatives. In Brazil and Mexico, indigenous peoples are disproportionately affected by the destruction of their traditional lands when forests are eroded for mining or intensive large-scale farming. When privatized – as happened in Russia after the fall of communism for example – huge fortunes are generated overnight for a small group of individuals.
The Global Network of Tax Havens
A powerful example of an economic system that is rigged to work in the interests of the powerful is the global spider’s web of tax havens and the industry of tax avoidance, which has blossomed over recent decades. The system is maintained by a highly paid, industrious bevy of professionals in the private banking, legal, accounting and investment industries.
As taxes go unpaid due to widespread avoidance, this leads to cuts in vital public services and that governments increasingly rely on indirect taxation, like VAT, which falls disproportionately on the poorest people.
This global system of tax avoidance is sucking the life out of welfare states in the rich world. It also denies poor countries the resources they need to tackle poverty, put children in school and prevent their citizens dying from easily curable diseases.
Almost a third (30%) of rich Africans’ wealth – a total of $500bn – is held offshore in tax havens. It is estimated that this costs African countries $14bn a year in lost tax revenues. This is enough money to pay for healthcare that could save the lives of 4 million children and employ enough teachers to get every African child into school.
Tax avoidance is a problem that is rapidly getting worse and has rightly been described by the International Bar Association as an abuse of human rights and by the President of the World Bank as ‘a form of corruption that hurts the poor’.
Increasing Returns to Capital Versus Labour
One of the key trends underlying increasing wealth inequality is the increasing return to capital versus labour. In almost all rich countries and in most developing countries, the share of national income going to workers has been falling. This means workers are capturing less and less of the gains from growth. In contrast, the owners of capital have seen their capital consistently grow (through interest payments, dividends, or retained profits) faster than the rate the economy has been growing.
NB This article in The Economist challenges the idea that there are increasing returns to capital versus labour!
The Growth of the Financial Sector
The financial sector has grown most rapidly in recent decades, and a recent study by the OECD10 showed that countries with oversized financial sectors suffer from greater economic instability and higher inequality. Certainly, the public debt crisis caused by the financial crisis, bank bailouts and subsequent austerity policies has hurt the poorest people the most.
NB2 – given that measuring inequality involves measuring relative wealth – that is what percentage share to the richest 10% control compared to other 90%, for example, then we’re necessarily looking at a zero sum game – If the richest 10% go from controlling 40% of the world’s wealth to 60% of the worlds wealth, then the amount of wealth controlled by the other 90% of the population must fall from a 60% share to a 40% share.
Is Increasing Global Inequality a Problem for Humanity?
Neoliberals argue that increasing inequality isn’t necessarily a bad thing, the important thing is that even though the rich have got richer compared to the poor, the poor have also got richer, just not as rapidly as the rich and the middle.
However, Oxfam argues that growing economic inequality is bad for us all for the following reasons:
It undermines growth and social cohesion and the consequences for the world’s poorest people are particularly severe.
Had inequality within countries not grown since 2010, an extra 200 million people would have escaped poverty. That could have risen to 700 million had poor people benefited more than the rich from economic growth.
The International Monetary Fund (IMF) recently found that countries with higher income inequality also tend to have larger gaps between women and men in terms of health, education, labour market participation, and representation in institutions like parliaments.
The gender pay gap was also found to be higher in more unequal societies. It is worth noting that 53 of the world’s richest 62 people are men.
From and ecological point of view, there’s even more injustice: the poorest people live in areas most vulnerable to climate change, the poorest half of the global population are responsible for only around 10% of total global emissions. The average footprint of the richest 1% globally could be as much as 175 times that of the poorest 10%.
What can we do to make the world a more equal place?
Oxfam notes that inequality is not inevitable. The current system did not come about by accident; it is the result of deliberate policy choices, of our leaders listening to the 1% and their supporters rather than acting in the interests of the majority. It is time to reject this broken economic model.
As a priority, Oxfam is calling on all world leaders to agree a global approach to end the era of tax havens
World leaders need to commit to a more effective approach to ending tax havens and harmful tax regimes, including non-preferential regimes. It is time to put an end to the race to the bottom in general corporate taxation. Ultimately, all governments – including developing countries on an equal footing – must agree to create a global tax body that includes all governments with the objective of ensuring that national tax systems do not have negative global implications.
In addition Oxfam is calling on leaders to take action to show they are on the side of the majority through doing the following:
Keep the influence of powerful elites in check: for example by reforming the regulatory environment, particularly around transparency in government; separating business from campaign financing; and introducing measures to close revolving doors between big business and government.
Share the tax burden fairly to level the playing field: by shifting the tax burden away from labour and consumption and towards wealth, capital and income from these assets; increasing transparency on tax incentives; and introducing national wealth taxes.
Pay workers a living wage and close the gap with executive rewards: by increasing minimum wages towards living wages; with transparency on pay ratios; and protecting workers’ rights to unionize and strikes.
Use progressive public spending to tackle inequality: by prioritizing policies, practice and spending that increase financing for free public health and education to fight poverty and inequality at a national level. Refrain from implementing unproven and unworkable market reforms to public health and education systems, and expand public sector rather than private sector delivery of essential services.
The richest 10% are 133 times wealthier than the poorest 10%. This post explores statistics on wealth and income inequalities in the UK
The wealthiest 10% of households in the UK are 133 times richer than the poorest 10% of households (1).
The disposable income of the richest 20% of households is 4.5 times greater than the poorest 20% (2).
Wealth Inequalities in the UK
In 2018-2022:
The richest 1% of households had a median wealth of more than £3.6 million.
The richest 10% of households had a median wealth of £1.9 million.
The poorest 10% of households had a median wealth of just £15,400.
This means the wealthiest 10% of households were 130 times richer than the poorest 10% of households. The wealthiest 10% were 233 times richer.
Components of wealth
As measured by the ONS wealth is made up of four main components:
Pensions
Property
Other physical assets
Cash savings
For the wealthiest households, private pensions make up a more significant portion of wealth. Pensions as a proportion of wealth becomes less significant the poorer the household is.
In middle-wealth households, property is the most significant proportion of wealth.
This probably means that for the ‘middle wealthy’ they are not as affluent as may appear. Most of these people will live in those households, no income is derived from that portion of their wealth. In contrast, pension wealth, which wealthier households have a lot more of, yields an income.
Trends in wealth distribution
The wealth of the richest 10% of households has decreased in the very long term. In 1900, the top 10% controlled over 50% of wealth. This declined to a low of 26.5% in 1970, but then increased to 38.7% in 2013. The proportion of wealth controlled by the top 10% has declined slightly over the last decade (3)
In 2021 the top 10% controlled 35.7% of wealth, compared to the bottom 50% who controlled only 20.4% of wealth.
According the Equality Trust, by 2023, the richest 50 families in the UK held more wealth than half of the UK population, comprising 33.5 million people.
Income inequalities in the UK 2022
Median equivalized disposable income for the richest 20% of households was £66002 in 2022, compared to £14508 for the poorest 20% of households (2).
This means the richest 20% of households had an income 4.5 times greater than the poorest 20% of households.
Disposable income is income after taxes and benefits. Equivalized means income is adjusted to take account of household composition because costs are different for single people, couples and families.
60% of this median income is £19409 which means that every single one of those households in the bottom quintile is in poverty, as are around half of the households in the second quintile.
It should be no surprise based on the above distribution that 13.4 million people or 20% of the population were living in poverty in 2020/2021.
The Joseph Rowntree Foundation also has measures of deep poverty, set at 50% of median income at £16174 a year and very deep poverty, at 40% or just under £13 000 a year.
Poverty has deepened in recent years, with more people falling into deep and very deep poverty. Based on the above distribution for example every household in the bottom quintile is in deep poverty, some will be in very deep poverty!
A more detailed income distribution
The Institute for Fiscal Studies has developed an online calculator where you can enter your income to see where you fit in to the distribution in the UK.
If you enter your income and costs you will show up as a red bar. (My screen capture below doesn’t show a red bar as I entered a fake high income, so my bar is off the scale to the right!).
What the graphic below shows is how many millions of people earn roughly what weekly income. Each bar represents an increase in income of around £7.
I put two arrows in to demonstrate that most people receive between £200 and £550 per week.
You can also see from the above bar chart that there are more people clustered towards the middle-left. Relatively few people have very high incomes!
The different shades of green are just to make the graphic easier to read.
All of the people in the first light shade of green to the left will classify as being in very deep poverty, with incomes of less than £190 a week.
Trends in income inequality
Disposable income inequality has increased considerably since 1977. As measured by the Gini Coefficient, income inequality has increased from 24.5% in 1977 to 34.7% in 2022 (4).
The Gini coefficient takes values between 0% and 100%, with higher values representing an increase in the level of inequality. A value of 0% indicates complete equality, a value of 100% complete inequality. A 100% score would mean one person (or household) has all the income.
Signposting and related posts
Poverty is a concept that is often linked with wealth (you might crudely say that poverty is the opposite of wealth).
Wealth and income inequalities are closely correlated with social class, although economic measurements are just one indicator of social class, which is a broader concept, also encompassing social and cultural capital (if we are going to use the latest social class survey – see here for an introduction to the concept of social class.


 United States
 China
China Japan
Japan Germany
 United Kingdom
 France
 India
India Italy
Italy Canada
 Spain
Spain South Korea
 Australia
 Taiwan
 Switzerland
 Netherlands