The state of the nation

Is life in the UK getting better or worse? In this post I evaluate this question by looking at a few official statistics.

Is life in the UK getting better or worse?

This post looks at a few economic and social indicators to see what they suggest about trends in desirable social goods such as economic growth, employment and happiness and less desirable social problems such as crime, mental ill-health and suicide.

The point of this posts is to showcase some of the official statistics we might use to judge the state of the nation. These are the kind of stats we can use to evaluate the Functionalist view that ‘everything in society is generally OK’, compared to other more critical perspectives such as Marxism, Feminism or even Postmodernism.

You should always be critical of the validity of statistics, especially since most of the stats below are official statistics – they are collected by government agencies…

A social or economic indicator might suggest life in the UK is generally getting better or worse, but this might not actually be the case when you scratch beneath the surface.

For example, an increase in recorded crime may not be because of an underlying increase, but rather because people are more aware of certain types of crime and more likely to report those crimes.

Similarly, a decrease in unemployment may just be because more people are fearful of claiming benefits, even though they need them, because of the increased hassle and stigma of claiming them.

Any statistics that use averages may also give us a misleading picture of the ‘health of the nation’. For example, average income can trend upwards, but this doesn’t tell us how that income is distributed – it may mean the top 1/10th getting a lot richer and the bottom 1/10th getting a lot poorer.

Averages can also hide wide variations in how social goods and harms are distributed by gender and ethnicity and age. The male suicide rate is around three times higher than the female suicide rate.

Employment is increasing, unemployment is declining

The employment rate is at a record high of 76.3%, while the unemployment rate has been declining for 6 years, and stands at a very low 3.8%

Source: Labour Market Overview, January 2020.

Suicide Rates have shown a recent increase

In 2018, a total of 6,507 suicides were registered in the UK, equivalent to 11.2 deaths per 100 000 of the population.

Suicide rates have been steadily decreasing for the last 40 years, but there was a statistically significant increase from 2017 to 2018.

It’s also worth noting that the male suicide rate is three times higher than the female suicide rate.

Sources: Suicides in the UK: 2018 Registrations.

Fewer households in absolute poverty, the same amount in relative poverty

If we look at households in ‘absolute low income’ (the bottom two graphs below) then we see a decline. Focusing on the ‘after housing costs’ statistics:

  • In 2002/03 24% of households were in absolute low income, compared to only 19% in 2017/18.
  • If we look at relative low income, there is no change over time, 22% of households are still classified as low income households.

Source: Households Below Average Income.

Crime rates are remaining stable

However, some types of crime have increased recently

Robbery and knife crime have increased recently, although there are very few cases of these types of crime compared to theft and fraud, and while the later has increased, the impact of fraud on victims is probably less harmful than for most other types of crime.

Source: Crime in England and Wales
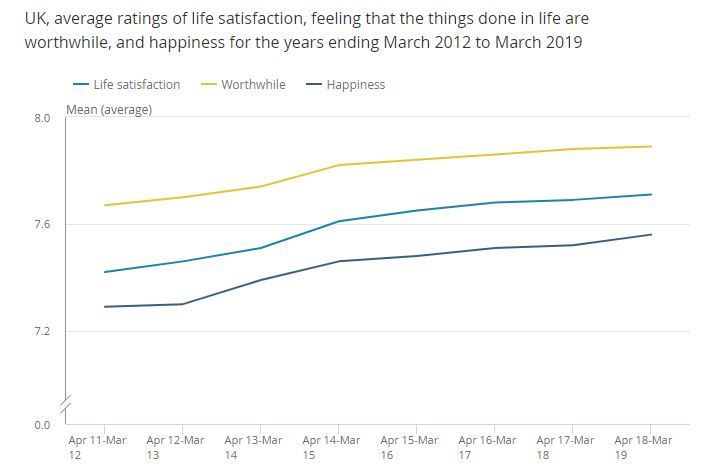
People are happier

The mean happiness score (/10) for the UK population has increased to all time high of 7.56. ‘Life satisfaction’ and ‘worthwhileness’ scores are also increasing

Anxiety levels are stable

The mean anxiety score (/10) has remained stable at just below 3/10 for half a decade, while the percentage of people reporting high levels of anxiety remains at just under 20%.

Source for the above two sets of stats: Personal and Economic well-being indicators.

The UK’s Population is Increasing

In 2018, the UK’s population reached 66.4 million people, with a growth rate of 0.6% and immigration being the main reason for population growth.

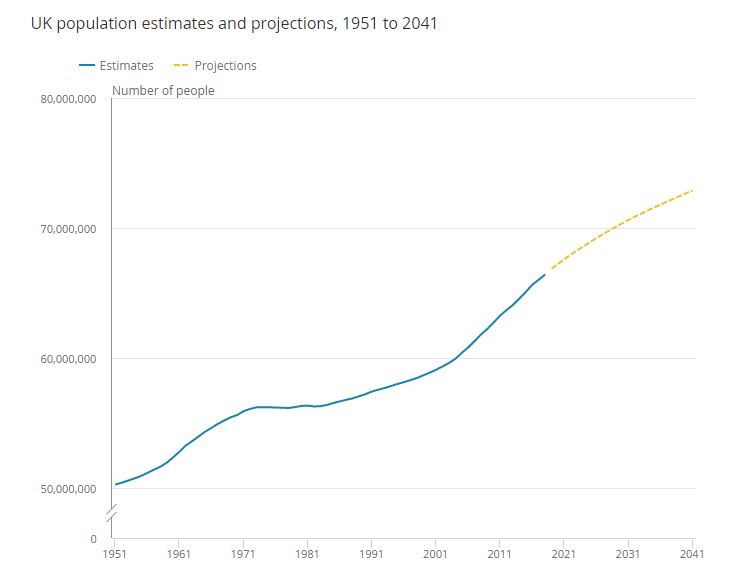
The population is increasing at roughly 350 000 people per year, just over 100 000 of these are due to ‘natural change’ (more births than deaths) while just over 200 000 are due to net migration (more people immigrating than emigrating.

Source: Overview of the UK population.

Conclusion: Is life in the UK getting better or worse?

On balance I’d say that the official statistics above suggest that, on average, life in the UK is getting better:

  • Employment and poverty are both down.
  • Crime is generally down
  • Happiness is increasing and anxiety is stable

However, there has been a recent spike in the suicide rate and some types of violent crime are up.

It’s very difficult to say whether or not the increasing population is a positive or a negative: clearly the fact that this is driven mainly by immigration concerns a lot of people, but possibly we need migration to offset the increasing dependency ration associated with the aging population, so this might actually be a good sign!

Question: what other stats do you think should be included in the above?

What is Normal?

The concepts of ‘normal’, and ‘normality’, and the question of what counts as ‘normal behaviour’ has long been of interest to sociologists. Sociologists from different perspectives have very different approaches to answering the basic, but fundamental question, ‘what is normal’?

For the early positivists such as August Comte and Emile Durkheim, uncovering the existence of social norms (or typical patterns of behaviour) was central to their early positivist sociology. However, contemporary sociologists are more likely to question whether or not there is such a thing as ‘normal’ in our postmodern society.

Source: Google Ngram’s viewer

Interest in the word ‘normal’ started to grow in line with early Positivist sociology, peaked during the ‘heyday’ of structuralist sociology in the 1940s-70s and has been in decline since the (contested) shift to postmodern society from the 1980s… 

What is Normal?

‘Normal’can be defined as any behavior or condition which is usual, expected, typical, or conforms to a pre-existing standard.

‘Normal behaviour’ may be defined as any behaviour which conforms to social norms, which are the expected or typical patterns of human behaviour in any given society.

It follows that in order to establish what ‘normal’ behaviour is, sociologists firstly need to establish what social norms are present in any given society.

This is actually more difficult than it may sound, because social norms exist at ‘different levels’ of society (at least for those sociologists who actually believe social norms actually exist!)

Some social norms exist at the level of society as a whole, known as ‘societal level norms’, which tend to be very general norms, such as ‘obeying the law most of the time’ or ‘children being expected to not talk to strangers’.

Other norms are context-dependent, and are specific to certain institutions – for example the specific norms associated with sitting a formal examination within an educational setting, or those associated with a funeral. (In some respects the two examples are quite similar!)

Social norms can also vary from place to place, time of day, and different norms may be expected of people depending on their social characteristics: their age, or gender for example.

Given all of the above problems with establishing the existence of social norms, postmodern sociologists have suggested that we need to abandon the concept of normality all together, and just accept the fact that we live in a society of individuals, each of whom is unique.

However, many contemporary sociologists disagree with this postmodern view, given then fact that there do appear to be certain patterns of behaviour which the vast majority of people in society conform to.

The remainder of this post will consider a range of examples of behaviours which might reasonably be regarded as ‘normal’ in the context of contemporary British society….

How might sociologists ‘determine’ what is ‘normal’?

As far as I see it, there are a number of places sociologists can look, for example:

  1. They can simply start out by making observations (possibly backed up by ‘mass observation’ data) of daily life, which will reveal certain General norms of behavior.
  2. They can use statistical data to uncover ‘life events’ or actions that most people will engage in at some point during their ‘life-course’.
  3. They can look at statistical averages.
  4. They can look at attitude surveys and field experiments to find out about typical attitudes towards certain objects of attention and typical behaviours in specific contexts.
  5. They can simply look at the most popular tastes and actions which the majority (or ‘largest minority’ of people engage in.

Below I discuss the first three of these…

Normal behaviour in daily life….?

Simple observations of daily life (backed up with a few basic surveys) reveal there are several social norms that the vast majority of the public conform to. For example:

Wearing clothes most of the time

Despite the fact that according to one survey as many as 1.2 million people in the UK define themselves as naturists (which is about as many as there are members of the Church of England), only 2% of people report that they would ‘get their kit off too’ if they came across a group of naked people playing cricket on a beach while on a coastal ramble’.

[poll id=”2″]

Brushing your teeth at least once a day

96% of Britons brush their teeth at least once a day, with only 2% of people saying they don’t brush at least once daily, and 2% of confused people saying they don’t know how often they brush.

Ignoring other people on public transport….

You probably don’t think about it very much, but nearly all of us do it – ignoring other people on public transport. So much so that if you type in ‘avoiding people on public transport’ to Google, then the first search return is actually a link to ‘how to do it‘… from ‘sitting by yourself and putting a bag on the seat next to you’ to (most obviously) using your mobile phone or eating something. There’s even advice on how to ‘disengage’ from conversation, just in case some deviant is socially unaware enough to talk to you.

The limitations of establishing ‘normality’ from such ordinary, everyday behaviours…

While most of us engage in such behaviours, is this actually significant? Do these ‘manifestations of similarity’ actually mean anything? Most of us brush our teeth, most of us ignore each other on public transport, most of us wear clothes, but so what?

All of these manifestations of ‘normality’ are quite passive, they don’t really involve much of a ‘buy in’, and there’s still scope for a whole lot of differences of greater significance to occur even with all of us doing all of these ‘basic’ activities in unison…

Life Course Norms…?

It’s probably not as simply as ‘normal life in the U.K.’ as equating to having a 9-5 job, a mortgage, a fuck off big television, walking the dog, paying taxes and having a pension….

<iframe width=”560″ height=”315″ src=”https://www.youtube.com/embed/W9ZNKGrpnKM&#8221; frameborder=”0″ allow=”autoplay; encrypted-media” allowfullscreen></iframe>

But it possible to identify some ‘life-events’ that the vast majority of people in the United Kingdom (or at least England in some of the examples below) will experience at some points in their life. All of the examples below are take from across the A-level sociology syllabus…

Most children in the United Kingdom will go to school….

According to World Bank data, 98.9% of children in the United Kingdom are enrolled in school, so it’s reasonably fair to say that ‘it is normal for children in the UK to go to secondary school’.

NB – it’s probably worth pointing out that ‘secondary school enrollment is much more common in the UK compared to the United States, and especially Uruguay, and various other less economically developed countries.

Of course the fact that nearly 99% of children are enrolled in secondary school in the UK tells us nothing about their experience of education, or how long they actually spend in school, but nonetheless, being enrolled and being subjected to the expectation to attend secondary school in the UK is one of the most universal experiences through the life-course.

Most people in the U.k. will engage in paid work or live with someone who has engaged in paid work at some point in their lives

Only 0.8% of 16-64 year olds live in households where all members have never worked. These figures don’t actually tell us how many people have never worked, but we can say that 99.2% of the adult population has either worked, or is currently living with someone who has, at some point in their lives, worked.

Most people will live until they are over 50

Source: ONS, based on registered deaths

‘Only’ 9.2% of men and 5.7% of women will die before the age of 50, according to ONS data averaged over the last 20 years.

Limitations of establishing ‘normal’ behaviour from these trends 

The limitations of deriving an idea of ‘normality’ from life-course data is that you are much less likely to find norms across the generations rather than in one specific age-cohort. More-over, one of main reasons postmodernists argue that it is no longer appropriate to talk about social norms today is that there is a trend away from shared norms in many areas of social life and a movement towards greater diversity.

Social Norms based on statistical averages 

A third method of determining what is ‘normal’ is to look at the ‘median’ value of a distribution, that is the value which lies at the midpoint.

In social statistics, it is very like that the median will provide a more representative average figure than the mean because a higher percentage of people will cluster around the median compared to the mean.

Median disposable household income in the UK in 2017 was £27,300

average household income ONS data 2017

Source: Household disposable income and inequality in the UK: financial year ending 2017

Average household size in the UK in 2016 was 2.4 

Source: ONS

Limitations of establishing ‘normal behaviour’ from medians or means

Is the median the ‘best’ way of establishing ‘what is normal’? Even though it’s the figure around which most people cluster, there can still be enormous differences in those at both ends of the distribution.

As to the mean, as with the household average above…. this might be useful for establishing trends over time, but surely when we look at ‘today’, this is meaningless… there are no households with 2.4 people in!

So… is there such a thing as normal?

While it is possible to identify ‘norms’ using various methods, hopefully the above examples at least demonstrate why postmodernists are so sceptical about the concept of normality today!


The Education System in England and Wales

An introduction to the key features of the UK education system, including details of the Department for Education, OFSTED, key stages, exams, the National Curriculum, and some straightforward definitions of the different types of school in the UK.

I wrote this post to give students studying A-level sociology a more focused intro the topic than the Wikipedia entry on education in the UK, which IMO is a bit too formal, and not focused enough on the things people actually want to know about!

This post mainly deals with education in England, I’ll update with a focus on Wales and Scotland as and when I can…

Education in the United Kingdom is overseen by the Department for Education (DfE), which oversees the delivery of education to almost 12 million pupils aged 5-18 in 21 000 state primary schools, 4100 state secondary schools, as well as hundreds of further education colleges, with a total budget of £84 billion in 2015-16.

The DFE works with a further 17 agencies or public bodies, the most well-known of which is probably OFSTED, which has the responsibility for inspecting schools on a regular basis.

Local government authorities (LEAs) are responsible for state-funded schools and colleges at a local level, but in recent years most LEA schools have converted to Academy status which means they are free from local education control and receive their funding directly from central government and do not have to follow the National Curriculum.

There are five stages of education

  • Early Years Foundation Stage (ages 3–5)
  • Primary education (ages 5 to 11)
  • Secondary education (ages 11 to 16)
  • Further education (ages 16 to 18)
  • Tertiary education (for ages 18+).

School Leaving Age

Full-time education is compulsory for all children aged 5 to 18, either at school or otherwise. Children between the ages of 3 and 5 are entitled to 600 hours per year of optional, state-funded, pre-school education. This can be provided in “playgroups”, nurseries, community childcare centres or nursery classes in schools.

Students can leave school at 16 but must then do one of the following until they are 18:

  • stay in full-time education, for example at a college
  • start an apprenticeship or traineeship
  • spend 20 hours or more a week working or volunteering, while in part-time education or training

The National Curriculum

The national curriculum is a set of subjects and standards used by primary and secondary schools so children learn the same things. It covers what subjects are taught and the standards children should reach in each subject.

Academies and private schools don’t have to follow the national curriculum. Academies must teach a broad and balanced curriculum including English, maths and science. They must also teach religious education.

Key Stages, and National Assessments/ Exams

The national curriculum is organized into blocks of years called ‘key stages’ (KS). At the end of each key stage, there are formal assessments of how children have progressed:

Key Stages of UK Education

The General Certificate of Secondary Education (GCSE)

GCSEs are the main type of exam taken by pupils at the end of secondary education, aged 16, although they may be taken at any age. From 2017, GCSEs will be graded from 9 to 1 with 9 being the highest grade, replacing the old A* to G grading system)

BTECs can also be taken. The difference between BTECs and GCSEs is that the BTEC course is heavily coursework-based.

Most students will sit 8-10 GCSEs or BTEC equivalents.

There are a number of GCSEs available to students – English and Maths are both compulsory, but besides those students can choose from a range of science and humanities subjects, including sociology!

Achieving five or more A*–C grades, including English and Maths, is often a requirement for taking A-levels and BTEC Level 3 at a sixth form college or at a further education college after leaving secondary school.

Types of State-Funded School in England and Wales

The main types of state school include:

Local Education Authority Maintained schools

A local education authority maintained school is one in which the governing body (the head teacher, and governors) are responsible for the day to day running of the school, but the Local Education authority controls the following:

  • It owns the land and buildings, and is responsible for funding and the school.
  • It employs the staff and provides support services, for example, psychological services and special educational needs services.
  • It determines the admissions policies of the school
  • The pupils have to follow the national curriculum

(Voluntary aided) Faith Schools

Voluntary aided faith schools still follow the national curriculum, but they are free to teach what they want in terms of religious education. There are two important differences with regular LEA schools.

  • The land and buildings are usually owned by the religious organisation.
  • The religious organization, through the governing body, has more of a say in employing the staff and setting admissions criteria.

Academies

Academies receive their funding directly from the government, rather than through local authorities. In contrast to Local Education Authorities:

  • Funding goes directly to the governing body of the school from central government.
  • The governing body employs staff directly and can vary pay and conditions from staff member to staff member.
  • The governing body can select its own admissions criteria (in line with national guidelines)
  • The pupils do not have to follow the national curriculum

There are two types of academy: Converter academies – those deemed to be performing well that have converted to academy status; Sponsored academies – mostly underperforming schools changing to academy status and run by sponsors).

Free Schools:

Free schools are essentially a type of academy, but ‘any willing provider’ can set up a free school, including groups of parents.

Grammar Schools:

Grammar Schools are selective schools – they select pupils on the basis of academic ability, typically testing at the age of 10 or 11.

Independent schools

93% of schools in England are funded by state (ultimately paid for by the taxpayer), the remaining 7% are Independent, or private schools, funded privately by individuals, mainly by fees paid by the parents of the pupils who attend them.

Independent schools have more freedoms from government control than state schools.

Somewhat confusingly, some independent schools call themselves ‘grammar schools’ and ‘faith schools’.

Signposting

This was a brief post designed to provide some introductory material on the education system of the United Kingdom, for students studying A-level sociology.

I teach this material as part of an introduction to education, right at the beginning of the sociology of education (SCLY1) module, typically taught in the first year of study.

A related post to be studied alongside this is Education in the U.K. – Key statistics

Please click here to return to the homepage – ReviseSociology.com

Sources/ Find out More

Citizens Advice – Types of School

Full Fact – Academies – what do we know?

Government Web Site – Faith Schools.

Analyse two ways in which migration has affected household structures (10)

How to get full marks for a 10 mark ‘item’ question in sociology A-level.

This question cam up as part of the families and households option in A level sociology paper 2 (topics in sociology), June 2017.

Item C

In the 1950s, most immigrants into the United Kingdom came from Commonwealth countries such as India and Jamaica. More recently, many immigrants have come from European countries such as Poland. May immigrants are young adults seeking work. 

These migration patterns have affected household structures. 

Applying material from Item C, analyse two ways in which migration patterns have affected household structures in the United Kingdom. 

Answer (hints and tips)

Point one – has to be about the variation in Caribbean and Indian household structures… quite easy I think… Of course you could talk about both separately.

Point two – asks that that you talk about more recent structures, drawing on Polish immigration.

What kind of household structures could you discuss?

  • Number of people in the household – so single person, or multiple occupancy.
  • The relationships between the people in the household – married or not? Friends or families? Ages?
  • Gender roles in those households – domestic division of labour
  • Numbers of adults and children (e.g. single person households)
  • Matrifocal/ Patrifocal household
  • The relationships between people in one household and other households (maybe a useful way to demonstrated analysis)
  • Generational variations…

So a potential answer might look like this:

Point one – focusing on Caribbean and Indian migration

  • Caribbean households – 60% single parent families
  • Link to male unemployment/ racism in society
  • matrifocal households
  • Contrast to Indian households
  • Higher rate marriage/ lower rate divorce
  • But later generations – divorce more likely
  • Discuss Mixed race couples

Point two – focusing on European migration

Almost certainly less you can say about this! But as long as you’ve made the most of the previous point, you could easily get into the top mark band… 

  • Younger age structure
  • More likely to have children and be married
  • Higher proportion of married families with children
  • Probably more shared-households – younger people without children sharing.

Commentary

This is a pretty straightforward question on a sub-topic within demography on how migration has affected family life in the U.K. so absolutely fair enough to ask it as a question.

However, it does concern me that the AQA’s online specification explicitly directs teachers to really dated material, and most of the text books focus on this, while this exam question expects students to know about recent events relating to migration and the family which are neither on their online specification or in any of the major A level text books.

I think the AQA needs to relax it’s focus on that really dated material (the classic question on ‘Functionalism and the Family’ in the same paper is a good example of how students are expected to know in-depth this stuff from the 1950s) if it’s going to demand a more contemporary focus.

There’s absolutely nothing wrong with a contemporary focus, just all that dated material that was such a waste of time students learning (like Pahl and Volger FFS), just in case it came up. This is a real problem because it makes sociology lose credibility, undermining the discipline.

Critics might say this problem emerges from the fact that whoever sets the agenda for the AQA families and households syllabus is something of a timeserver who can’t be bothered to update the specification appropriately by cutting down all the dated material. They might cite as evidence for this the fact that the specification hasn’t really changed significantly in 30 years.

Full answer from the AQA 

Below is an example of an abbreviated (by me) marked response to this question, which achieved a top band-mark, 10/10 in fact!

The example is taken from the 2017 Education with Theory and Methods Paper (paper and mark schemes available from the AQA website).

The Question with Item 

10-mark-question-item-sociology

The Mark Scheme (top band only)

10-mark-question-item-mark-top-band-sociology.png

Student Response:

Item C points out that most immigrants come to Britain from commonwealth countries such as Jamaica. Bertod did a study of Caribbean families which found a type of individualism: the norm that people had to right to be free within marriage even if they had a child with the other person. This meant many Caribbean fathers chose not to stay with the mother of their children, leading to an increase in lone parent families.

Thus it follows that the increase in Caribbean immigration has lead to an increase in single parent families which is up from 10% in the 1970s to 23% today.

Item C also says that immigrants come from India. A study by Ballard found that South East Asians have collective, traditional values and tight knit extended families which support traditional family values – women having many children and being in the expressive role, and men in the breadwinner role, with close ties to grandparents.

This should mean an increase in traditional extended families in the UK due to Indian immigration, however the statistics do not confirm this as the divorce rate has increased dramatically since the 1970s. This does not support the idea of increased traditional families as these value marriages.

However, functionalists argue that divorce can be healthy as it there is better quality relationships in surviving marriages and remarriages.

Examiner Commentary:

Mark: 10/10

aqa-sociology-paper-2-commentary.png

KT’s commentary:

  • This is overkill, easily 10/10!
  • Apparently 4 students died instantly of boredom on seeing the question because of reference to yet more sociology from before their parents were born. 

Source:

A-level
SOCIOLOGY
Feedback on the Examinations
Student responses and commentaries: Paper 1 7192/2 Topics in Sociology
Published: Autumn 2017

NB – this document is NOT available on the AQA website, but any teacher should have access to it via eaqa. I’m sharing it here in order to make the exam standards more accessible, and to support the AQA in their equality and meritocratic agendas, because there will be some poor students somewhere whose teachers aren’t organised enough to access this material for them.