Last Updated on September 22, 2025 by Karl Thompson
Social Surveys are one of the most common methods for routinely collecting data in sociology and the social sciences more generally. There are lots of examples of where we use social surveys throughout the families and households module in the A level sociology syllabus – so what do they tell us about family life in modern Britain, and what are their strengths and limitations….?
This information should be useful for both families and households and for exploring the strengths and limitations of social surveys for research methods…
Attitudes to non-traditional families
Findings from British Social Attitudes 37 suggests that the British public is becoming more supportive of non-traditional families.
Headline Fact – in 2018/19 only 12% of the UK population disapproved of people having children while cohabiting, down from 22% in 2006/07.

Disapproval for all types of non-traditional families decreased between 2006/7 and 2018/19.
Further analysis demonstrated this was due to a generational affect. In the previous round of surveys (2006/07) 50% of people born before 1927 disapproved of traditional families. However most of these had died by 2018/19 and so their attitudes did not show up in these later survey results.
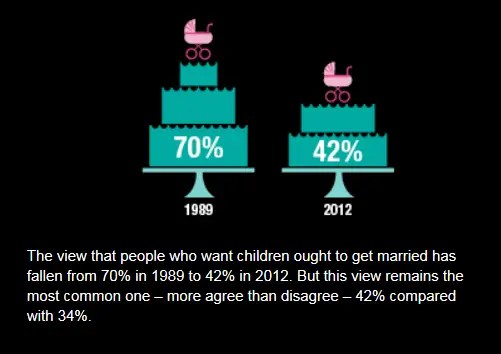
Back in 1989, seven people in ten (70%) felt that people should be married if they want to have children, compared with less two in ten (17%) who disagreed.
The number of people who think couples should get married before having children has fallen dramatically in the last 40 years. In 1989 70% of people believed couples should get married before having children. This had fallen to 42% in 2012.
Judging by the low 12% disapproval rate for ‘cohabiting with children’ it seems reasonable to say that even fewer people think couples need to get married before having children in 2023!
What are the strengths of this survey
- I’m tempted to say the validity is probably quite good, as this isn’t a particularly sensitive topic, and the focus of the questions is the ‘generalised other’, so there should be no social desirability.
- It’s very useful for making comparisons over time – given that the same questions have been asked in pretty much the same way over different years.
- Representativeness seems to be OK – NatCen sampled a range of ages, and people with different political views, so we can compare all that too – no surprises here btw – the old and the conservatives are more likely to be in favour of marriage.
What are the limitations of this survey?
The question above is so generalised, it might give us a false impression of how liberal people are. I wonder how much the results would change if you made the questions more personal – would you rather your own son/ daughter should be married before they had children? Or just different – ‘all other things being equal, it’s better for children to be brought up by married parents, rather than by non-married-parents’ – and then likehert scale it. Of course that question itself is maybe just a little leading….
Housework Surveys
Headline ‘fact’ – women still do 60% more housework than men (based on ONS data from 2014-15)

Women carry out an overall average of 60% more unpaid work than men, ONS analysis has shown.
Women put in more than double the proportion of unpaid work when it comes to cooking, childcare and housework and on average men do 16 hours a week of such unpaid work compared to the 26 hours of unpaid work done by women a week.
The only area where men put in more unpaid work hours than women is in the provision of transport – this includes driving themselves and others around, as well as commuting to work.
This data is derived from the The UK Time Diary Study (2014-15) – which used a combination of time-use surveys and interviews to collect data from around 9000 people in 4000 households.
It’s worth noting that even though the respondents were merely filling in a few pages worth of diary, this document contains over 200 pages of technical details, mainly advice on how researchers are supposed to code responses.
What are the strengths of this survey?
- The usual ease of comparison. You can clearly see the differences in hours between men and women – NB the survey also shows differences by age and social class, but I haven’t included that here (to keep things brief).
- It’s a relatively simply topic, so there’s unlikely to be any validity errors due to interpretation on the part of people completing the surveys: it’s obvious what ‘washing clothes’ means for example.
- This seems to suggest the continued relevance of Feminism to helping us understand and combat gender inequality in the private sphere.
What are the limitations of this data?
- click on the above link and you’ll find that there is only a 50% response rate…. which makes the representativeness of this data questionable. If we take into account social desirability, then surely those couples with more equal housework patterns will more likely to return then, and also the busier the couple, the less likely they are to do the surveys. NO, really not convinced about the representativeness here!
- this research tells us nothing about why these inequalities exist – to what extent is this situation freely chosen, and to what extent is it down to an ‘oppressive socialisation into traditional gender norms’ or just straightforward coercion?
- given all of the coding involved, I’m not even convinced that this is really that practically advantageous…. overall this research seems to have taken quite a long time, which is a problem given the first criticism above!
Surveys on Children’s Media Usage
TikTok, Snapchat and Instagram are the most popular social media apps used by teenagers. Around 40% of teenagers use these three apps.

Facebook usage among teens has decreased in recent years.
The data which produced these results comes from three separate tracking studies with a combined sample of over 10 000 children and their parents, data collected between March-November 2022. (OFCOM: Children and Parents: Media Use and Attitude Report).
Strengths of this Survey
- It makes comparisons over time easy, as the same questions are asked over a number of different years.
- Other than that, I think there are more problems!
Limitations of this Survey
- There are no details of how the sample was achieved in the methodology – so I can’t comment on the representativeness.
- There is so much data here it’s difficult to get an overview. For example there are no longer any easily accessible stats on how much total time children spend with media. The figures are broken down by media type, split into TV, gaming and social media for example.
SIGNPOSTING AND RELATED POSTS.
This material is mainly relevant to the families and households module, usually taught as part of the first year in A-level sociology.