Last Updated on September 22, 2025 by Karl Thompson
This post explores the similarities and differences in marriage and civil partnership between same sex and opposite sex couples in England and Wales. It has been written to fit in with the A-level Sociology families and households specification.
This table from the the Government Equality Office outlines some of the legal differences between marriage and Civil Partnerships for opposite and same-sex couples.
Trends in Civil Partnerships 2005-2018

The introduction of the Civil Partnerships Act in 2005 saw a huge number of male and female same sex couples becoming civil partners, with the yearly number of civil partnerships stabilising at just over 6000 a year in the late 2000s.
The introduction of same-sex marriage in 2014 saw a further drop, so that now there are just under 1000 civil partnerships a year, with male couples slightly more likely to form them than female couples.
It seems that marriage is taking over from civil partnerships.
The ONS reported in 2017 that ‘A total of 4,850 marriages were formed between same sex couples in 2014. Of these, 44% (2,129) were between male couples and 56% (2,721) were between female couples.’
Sources: ONS Civil Partnerships in England and Wales 2018, and 2017.
Married, Civil Partnered and Cohabiting Same Sex Households
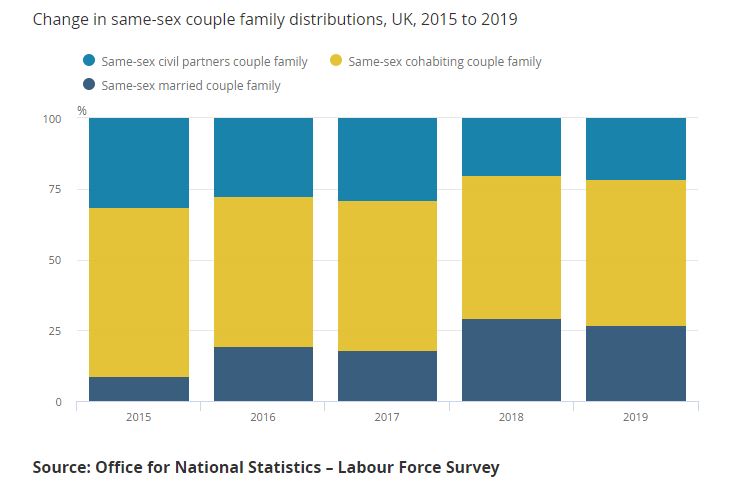
The number of same-sex couples married couple households has increased substantially between 2015-2019.
In 2019 approximately 50% of same-sex couples were either married or in a civil partnership, with around 50% cohabiting.
LGBTQ by marital status

Almost 70% of LGBTQ people identify as single. Interestingly around 12% are married to someone of the opposite sex.
Only 5-6% are divorced, but then again with such high rates of singledom, this maybe is to be expected!
Same-Sex Marriage in Global Perspective
This is an interesting article by the PEW global research center which explores briefly the 20 or so countries in which same sex couples can get married…

Civil Partnership Dissolutions

At first glance, these seem to have rise to quite a high number – in 2018 there were almost as many dissolutions as there were newly formed civil partnerships!
NB Women are more likely to dissolve than men, even though they are less likely to form a civil partnership in the first place. In fact, 80
Source: ONS Civil Partnerships in England and Wales 2018.
The median duration of marriage for same-sex couples who divorced in 2018 was 3.9 years for men and 3.5 years for women. (ONS, Divorces in England and Wales 2018). 80% of divorces are to female couples!
NB there is currently very little data to go on for same sex divorces, as there are so few marriages!
Please click here to return to the homepage – ReviseSociology.com