Concepts in Quantitative Sociological Research

Concepts are the building blocks of theory, and are the points around which social research is conducted.

Concepts are closely related to the main sociological perspectives, and some of the main concepts developed by different perspectives include:

  • Functionalism – social integration and anomie
  • Marxism – social class and alienation.
  • Feminism – gender and patriarchy
  • Interactionism – labelling and discrimination
  • Postmodernism – identity.

Within sociology, one might even say that there’s a more ‘fundamental’ layer of concepts that lie behind the above – such as ‘society’, ‘culture’ and ‘socialization‘, even ‘sociology’ itself is a concept, as are ‘research’ and ‘knowledge’.

Concepts also include some really ‘obvious’ aspects of social life such as ‘family’, ‘childhood’, ‘religious belief’, ‘educational achievement’ and ‘crime’. Basically, anything that can be said to be ‘socially constructed’ is a concept.

Each concept basically represents a label that researchers give to elements of the social world that strikes them as significant. Bulmer (1984) suggests that concepts are ‘categories for the organisation of ideas and observations’.

Concepts and their measurement in quantitative research 

If a concept is to be employed in quantitative research, a measure will have to be developed for it so it can be quantified.


Once they have been converted into measures, concepts can then take the form of independent or dependent variables. In other words, concepts may provide an explanation of a certain aspect of the social world, or they may stand for things we want to explain. A concept such as educational achievement may be used in either capacity – we may explore it as a dependent variable (why some achieve fewer GCSE results than others?) Or: as an independent variable (how do GCSE results affect future earnings?).

Measures also make it easier to compare educational achievement over time and across countries.

As we start to investigate such issues we are likely to formulate theories to help us understand why, for example, educational achievement varies between countries or over time.

This will in turn generate new concepts, as we try to refine our understanding of variations in poverty rates.

Why Measure Concepts?

  1. It allows us to find small differences between individuals – it is usually obvious to spot large differences, for example between the richest 0.1% and the poorest 10%, but smaller once can often only be seen by measuring more precisely – so if we want to see the differences within the poorest 10%, we need precise measurements of income (for example).
  2. Measurement gives us a consistent device, or yardstick for making such distinctions – a measurement device allows us to achieve consistency over time, and thus make historical comparisons, and with other researchers, who can replicate our research using the same measures. This relates to reliability.
  3. Measurement allows for more precise estimates to be made about the correlation between independent and dependent variables.

Indicators in Quantitative Social Research 

Because most concepts are not directly observable in quantitative form (i.e. they do not already appear in society in numerical form),  sociologists need to devise ‘indicators’ to measure most sociological concepts. An indicator is something that stands for a concept and enables (in quantitative research at least) a sociologist to measure that concept.

For example….

  • We might use  ‘Average GCSE score’ as an indicator to measure ‘educational achievement’.
  • We might use the number of social connections an individual has to society to measure ‘social integration’, much like Hirschi did in his ‘bonds of attachment theory‘.
  • We might use the number of barriers women face compared to men in politics and education to measure ‘Patriarchy’ in society.

NB – there is often disagreement within sociology as to the correct indicators to use to measure concepts – before doing research you should be clear about which indicators you are using to measure your concepts, why you are choosing these particular indicators , and be prepared for others to criticize your choice of indicators. 

Direct and Indirect indicators 

Direct indicators are ones which are closely related to the concept being measured. In the example above, it’s probably fair to say that average GCSE score is more directly related to ‘educational achievement’ than ‘bonds of attachment’ are to ‘social integration’, mainly because the later is more abstract.

How sociologists devise indicators:

There are a number of ways indicators can be devised:

  • through a questionnaire
  • through recording behaviour
  • through official statistics
  • through content analysis of documents.

Using multiple-indicator measures

It is often useful to use multiple indicators to measure concepts. The advantages of doing so are three fold:

  • there are often many dimensions to a concept – for example to accurately tap ‘religious belief’ questionnaires often include questions on attitudes and beliefs about ‘God’, ‘the afterlife’, ‘the spirit’, ‘as well as practices – such as church attendance. Generally speaking, the more complex the concept, the more indicators are required to measure it accurately.
  • Some people may not understand some of the questions in a questionnaire, so using multiple questions makes misunderstanding less likely.
  • It enables us to make more nuanced distinctions between respondents.

Measuring the effectiveness of measures in quantitative social research

It is crucial that indicators provide both a valid and reliable measurement of the concepts under investigation.


What is an Indicator?

An indicator provides a measure of a concept, and is typically used in quantitative research.

It is useful to distinguish between an indicator and a measure:

Measures refer to things that can be relatively unambiguously counted, such as personal income, household income, age, number of children, or number of years spent at school. Measures, in other words, are quantities. If we are interested in some of the changes in personal income, the latter can be quantified in a reasonably direct way (assuming we have access to all the relevant data).

Sociologists use indicators to tap concepts that are less directly quantifiable, such as job satisfaction. If we are interested in the causes of variation of job satisfaction, we will need indicators that stand for the concept of ‘job satisfaction’. These indicators will allow the level of ‘job satisfaction’ to be measured, and we can treat the resulting quantitative information as if it were a measure.

An indicator, then, is something which is devised that is employed as though it were a measure of a concept.

Direct and Indirect indicators 

Direct indicators are ones which are closely related to the concept being measured. For example questions about how much a person earns each much are direct indicators of personal income; but the same question would only be an indirect measurement of the concept of social class background.


Indicators of Health in International Development

Health is a crucial indicator of development – The International Aid community believe that health is the most important thing to spend money on – with around 90% of the aid budget being spent in this area.

Four basic measurements of health in development

It is possible to classify these indicators differently, but for the purposes of A-level sociology, I think four are sufficient:

  • Life Expectancy – The average number of years people are expected to live in a country (which if you remember makes up one of the three indicators of the Human Development Index).
  • Child Mortality – The number of children which die before their first birthday (measured per thousand).
  • Maternal Health – The number of women who die as a result of pregnancy or childbirth. 
  • Disease indicators – The proportion of the population that has AIDS, Malaria, diarrheal and other infectious diseases.

On all of the above four ‘indicators of health’, things are generally worse in lower income countries than higher income ones.

Life Expectancy

in the UK average life-expectancy is 81.25 years and while this has been reduced by one year due to coivd-19). It is still far better than in the poorest countries on earth. According to statistics from Our World in Data Life Expectancy in Nigeria is 54.7 years, and in neighbouring Central African Republic it is 53.3 years.

Child Mortality

According to the World Health Organisation substantial global progress has been made in reducing child deaths in the last three decades. Since 1990, the global under-5 mortality rate has dropped by 59%, from 93 deaths per 1,000 live births in 1990 to 38 in 2019.

However, Sub-Saharan Africa remains the region with the highest under-5 mortality rate in the world, with 1 child in 13 dying before his or her fifth birthday. Nigeria and India alone account for almost a third of all deaths.  Half of all under-five deaths in 2019 occurred in just five countries: Nigeria, India, Pakistan, the Democratic Republic of the Congo and Ethiopia.

Maternal Health

According to the World Health Organisation in approximately 295 000 women died from preventable causes related to pregnancy and childbirth, equivalent to almost 900 per day.

Women die from complications such as severe bleeding (mostly bleeding after childbirth), infections (usually after childbirth), high blood pressure during pregnancy (pre-eclampsia and eclampsia) complications from delivery and unsafe abortions.

86% of these preventable deaths were in Sub-Saharan Africa and young adolescent women aged 10-15 are especially at risk of dying maternal related deaths.

Disease indicators

In developing countries, the main causes of death are:

Most of the above causes of death are preventable and linked to poverty, poor nutrition and low standards of maternal care.

The main cause of death ‘neonatal conditions’ is clearly related to the relatively high child mortality rates and poor maternal health in low-income countries.

Lower Respiratory Infections – means mainly pneumonia, a complication which can develop from having the flu if you have a more immune system, in turn due to a poor diet.

Diarrhoeal diseases are linked to poor water and sanitation.

Heart Disease and Stroke are the main causes of death in high income countries, so the fact that these are increasing (kind of ironically) is a sign of economic development taking place!

Progress in improving health…

It’s worth noting how much progress has been made on improving health since the year 2000 and the start of the Millennium Development Goals.

In 2015 the main causes of death were:

  1. Lower respiratory infections11.3%
  2. Diarrheal diseases8.2%
  3. HIV/AIDS7.8%
  4. Heart disease 6.1%
  5. Malaria 5.2%
  6. Tuberculosis 4.3%
  7. Prematurity and low birth weight 3.2%
  8. Birth asphyxia and birth trauma 2.9%
  9. Neonatal infections 2.6%

Note how today Malaria and HIV have fallen down the league tables and Heart Disease and stroke, both diseases associated with longer life expectancy, have entered the top 10!

Relevance to A-level Sociology

SignPostin

The Scale of the World’s Largest Corporations

I thought it’d be useful to do a little post on the sheer scale of global corporations, so below I simply list the top 10 by revenue and then in italics next to them I’ve put the countries who rank immediately below them by nominal GDP* at 2016 figures.

The Fortune 500 magazine publishes the list of the top 500 global corporations by revenue annually.

wal-mart.jpg

The Fortune Global 500 top 10 list by annual revenue (published 2017) are:

  1. WalMart Stores (US)  – $485.8bn (Poland – $467 bn, GDP rank 35 )
  2. State Grid (China) – $315.1bn (Denmark – $306 bn, GDP rank 24 )
  3. Sinopec (China) – $267.5bn
  4. China Natural Petroleum (China) – $262.6bn (Chile – $247 bn, GDP rank 44)
  5. Toyota Motor (Japan) – $254.7bn (Finland – $246 billion, GDP rank 45)
  6. Volkswagen (Germany) – $240.2bn
  7. Royal Dutch Shell (Netherlands) – $240bn
  8. Berkshire Hathaway (US) – $223.6bn
  9. Apple (US) – $215.6bn
  10. Exxon Mobil (US) – $205bn (Portugal, $204 billion, GDP rank 47)
  11. (The 10 poorest countries in Africa – approx combined GDP = $190bn)

The top 10 companies in the list above consists almost entirely of Chinese and American firms – just three are from different countries: Germany, Japan and The Netherlands. The largest British firm on the list by revenue – BP – comes in at number 12.

More than a fifth of those on the latest list – 109 companies – call China home, up from only 29 companies a decade ago.”

Banking was the industry with the most number of companies on the list, at 55, followed by automakers/parts suppliers with 34, and petroleum refiners with 28.

In terms of countries, all of the very large population countries are way more economically powerful than any of the TNCs, and nearly every relatively large population Western European countries are richer than those TNCs.

However, there are plenty of European powers which are mixing it in with these corporations and only TWO African countries which mix it with the top ten TNCs – Nigeria and South Africa.

POLA0001
Walmart – had a higher 206 Revenue than Poland’s 2016 GDP

*I know there are problems comparing GDP and Revenue! I covered that in a previous post

Just for contrast… the Top 10 Largest UK companies by revenue are:

  1. BP – $186,606m
  2. Legal and General Group – $105,235m
  3. Prudential – $96,965m
  4. HSBC Holdings – $75,329m
  5. Aviva – $74,628m
  6. Tesco – $74,393m
  7. Lloyds Banking Group – $65,208m
  8. Vodafone Group – $58,611m
  9. Unilever – $58,292m
  10. SSE – $37,813m

It’s probably worth noting that 5 out of 10 on the above list are finance related companies (banking or insurance), while the rest really just provide ‘basic’ products – energy, communications and retail products. So the top end of the UK economy consists of a wierd combination of companies producing ‘the basics’ and ‘the evil dark arts of finance’. Thus you might say that our economy is 50% tangible or real.

Are Corporations more Powerful than Nation States?

This is all very well and good, but what does all this tell us about the power of TNCs compared to countries? Are TNCs actually more powerful, or is using revenue and GDP misleading? While they do both provide a measure of money flowing into a Corporation or a country on a yearly basis, they don’t take into account the nation state’s power of taxation and its (supposed) monopoly on certain forms violence…

Of course if we take the countries which rank above the top 10 companies – the USA, China and so on, it seems sensible to suggest that these two entities work hand in hand (Rex Tillerson being just the most obvious example), but when it comes to African nations, who barely register among the big boys, do they have any chance of standing up to such huge TNC entities?

Or is all of this moot with the rise of alternative economies, given that all of the above is measured in dollars?!?


Globalisation and Global Development: Good Resources

Some useful links to good teaching resources for Globalisation and Global Development.

Good resources providing an overview of global trends and global inequalities:

Firstly, this 2016 video imagines the world as 100 people, and so illustrates what percentage of people live on less than $2 a day and so on (once you get through the ‘basic’ stuff on ethnicity/ religion etc…

A few stand-out facts are:

  • 1% of the population own 50% of the world’s wealth
  • 15% don’t have access to clean water
  • less than 50% have access to the internet

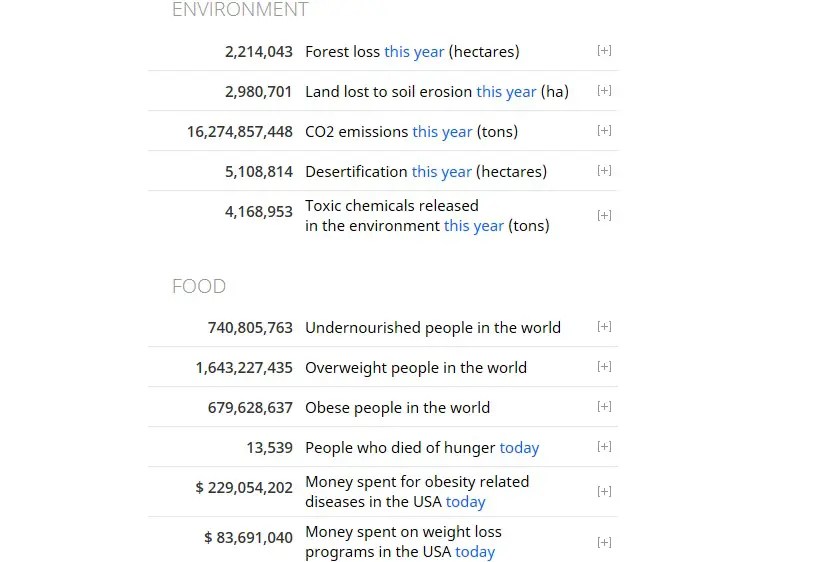
Secondly, Worldometers provides real time world statistics on population, the environment, food, health and media and society.

Global Statistics

A few stand-out facts are…..

  • The total number of malnourished people in the world is decreasing!
  • The total number of people with no access to clean drinking water is also decreasing!
  • HOWEVER, we’re losing approximately 20 HA a minute to desertification and 10 HA a minute to deforestation, which could undermine both of the above in the future.

Good resources for researching individual countries

  • The United Nation’s Country Profiles are probably the most accessible place to start – each country’s page gives you basic development indicators which you can then click on to expand.
  • The World Bank’s Open Data is also useful – follow the link and you can either search or browse by country.
  • The CIA World Fact Book is a useful source for more qualitative information on a country by country by country basis, organised into various categories such as geography, population, economics, politics and so on…

Good Resources for tracking ‘Indicators of Development’

Good Resources for other aspects of global development

More to follow shortly!


Assess the View that Economic Indicators Provide an Unsatisfactory Picture of Development

Economic definitions and ways of measuring development are unsatisfactory. A much clearer and more useful picture emerges when wider social factors are included.’ Assess this view of development and underdevelopment. (20)

International organizations such as the World Bank prefer to measure development using economic indicators such as Gross National Product (GNP) and Gross Domestic Product (GDP)

GDP measures the total value of goods and services produced within a country in one year that are available for sale in the market place. GNP is the same but includes the value of all goods and services produced at home and abroad.

The use of GNP as a measurement of development is generally considered most useful by Modernisation theorists who believe that high GNP is an indication of how industrialised a country is, as high levels of production require efficient production in factories, and as far as Modernisation Theory is concerned, industrialisation will eventually lead to the developing countries catching up with the high age of mass consumption found in the west, thus GNP is the single most useful indicator of development.

Overall GNP/ GDP are more useful if we want an indication of how ‘powerful’ a country is, but if we want a better indication of social development; we need to divided GNP by head of population and take the cost of living into account (GNP per capita at PPP).

The usefulness of using GDP/ GNP is that they provide snapshot indicators of development which makes for easy comparisons between countries. However there are problems with both indicators.

However, there are many criticisms of the use of GNP as an indicator of development.

Firstly. It can disguise inequalities within countries. The USA, for example, has one of the highest GNPs in the world but some groups experience extreme poverty, suffering homelessness for example.

Secondly, GNP does not tell us how much wealth actually stays in the country, If production is carried out by Western Corporations, much of the profit may leave the country and not benefit the population. Similarly, some countries have a high GNP but a massive proportion of this goes on debt repayments.

Thirdly, if economic growth is driven by industrialization, this may bring about problems for some people in developing countries. In India for example, some villagers have has their farms destroyed and been reduced to coal scavenging for a living following the construction of open cast coal mines that are necessary to fuel economic growth.

Finally, it is the case that quality of life may be higher than suggested in poorer countries because production is often subsistence based, about survival and consumed locally in the community, and not sold in the market place. Subsistence agriculture is not measured in the GNP. Also, some people may get hold of goods and services illegally. This kind of economic activity is not included in GNP measurements.

Because of the limitations of economic indicators, the UN has developed social indicators such as the Human Development Index and the Millennium Development Goals which provide a picture of social rather than economic progress.

Many of these social indicators show us that high GNP is not necessarily accompanied by social progress, as in the case of Equatorial Guinea, which has a very high GNP but low social development because the corrupt elite keep most of the money to themselves.

The Millennium Development goals also provide a more useful indicator or development than GNP – The MDGs includes such things as female empowerment and sustainability, neither of which are taken into account by cruder economic indicators. Female Empowerment is especially important when considering development in India – it is rapidly developing in terms of GNP, but has very low gender equality, suggesting it has a lot of progress to make in that area.

Post-Development thinkers argue that sustainability indicators are especially important now that we are facing a climate change crisis, and if we take this as a measure of development, many of the richest countries are the biggest polluters, because consumption drives economic growth, which in turn drives pollution, which provides one of the most compelling challenges to the use of GNP as a valid measure of development.

Another seemingly more useful indicator of development is the level of peacefulness in a country – as measured by the Global Peace Index – this is important because where there is conflict, there is no chance of development, moreover, if we use this as an indicator, the USA and China fall down the development league tables because they spend so much money on their militaries, which are frequently used to oppress people and again reduce social development at home and abroad.

Another country which prefers to measure social development rather than economic development is Bhutan, which is poor, yet one of the happiest nations on earth, and the case of Bhutan seems to challenge the notion that economic growth results in greater happiness – many people living in Tokyo in Japan for example, are lonely and miserable.

The very fact that these other indicators exist suggests that many working within development feel that economic indicators are not a satisfactory measurement of ‘development’

In conclusion, it is clear that economic indicators do not provide a full picture of how developed a country is, and that it is clearly possible to have social development without a high GDP.

Moreover, it appears that the pursuit of economic growth can undermine social development, at home, if it leads to greater equality and misery, and abroad, if it leads to environmental decline and war and conflict.

Thus I believe that we really do need to look at a much wider range of indicators to fully understand how developed a country is, because development simply cannot be understood purely in economic terms alone.