How I would’ve answered A level sociology paper 3: crime and deviance with theory and methods, June 2017

Crime and deviance with theory and methods is the third and final exam paper (7192/3) in the AQA A level sociology specification – below are a few thoughts on how I would’ve answered the paper from the June 2017 exam…

Sociology paper 3: Crime and Deviance with Theory and Methods, 2017 

Q01 – Two reasons for ethnic differences in offending

I’m a bit concerned that the plural on differences means you need to talk about two different ethnic groups… so to be on the safe side. (Of course it’s not obvious that you need to do this from the question, and maybe you don’t, but remember the AQA’s burning hatred of teenagers… I wouldn’t put it past them!

To be on the safe side…

  • African-Caribbeans more likely to end up in jail due to more serious nature offences (knife/ gun convictions) compared to whites
  • Asians over represented due to Islamophobia – more labelling by media/ public/ police = higher conviction rate.

Both of those need to be better articulated, but they are two completely different reasons!

The hub post for ethnicity and crime is here – official statistics on ethnicity and crime

Q02 – Outline three functions of crime

BOOM!

Or so you probably thought… it’s simply a matter of explaining Durkheim’s three functions of crime:

  • Integration
  • Regulation
  • Social chance

BUT – Have you really nailed the difference between integration (belonging/ connections) and regulation (clarity of rules/ prevention of anomie)?

Q03 – Analyse two ways in which deviant subcultures may respond to the difficulties of achieving mainstream goals

The item directs you to underachievement at school and deprived or unstable neighbourhoods. You could draw on the material from subcultural theory – so I’d go with…

  • Albert Cohen’s status frustration and the standard rebellious subcultures.
  • Then you could draw on Cloward and Ohlin’s subcultural types (there’s that burning hatred of teenagers again, this is turgid old stuff that could be relevant) – criminal or retreatist subcultures
  • To link into the above point you could draw on Merton’s responses to strain and just relate these to subcultures.

Q04 – Evaluate sociological contributions to crime prevention strategies

The item directs you to both right and left realism and then surveillance… so it’s simply a matter of

Obviously topped and tailed with an intro and conclusion

Q05 – Outline two advantages of choosing overt observation compared to covert observation

I covered this at the bottom of this post of participant observation, but you’d need to expand on all the points!

I’d probably go for point 1 validity and point 2 on ethics to make sure the two points are very different.

One thing you NEED to do for this is to compare the two -overt and covert!

Q06 – Evaluate the view that conflict approaches are more useful than consensus approaches in our understanding of society

Straightforward – the item directs you to consensus and Marxism and labelling theory (also Weber’s social action theory, but I’d leave that aside and just settle for 16 or 17 out of 20) and talks about power.

So simply –

Point 1 – Functionalism and evaluate using contemporary evidence

Point 2 – Marxism and evaluate using contemporary evidence

Point 3 – Social action theory and evaluate using contemporary evidence

Overall evaluation – use PM to criticise both, and conclude that conflict theories are absolutely more relevant!

Overall I thought this was a reasonable paper! Classic, even.

Scientific Quantitative Methodology in Sociology

Positivists prefer to the limit themselves the study of objective ‘social facts’ and use statistical data and the comparative method to find correlations, and multivariate analysis to uncover statistically significant ‘causal’ relationships between variables and thus derive the laws of human behaviour.

This post explores the Positivist approach to social research, defining and explaining all of the above key terms and using some examples from sociology to illustrate them.

Social Facts

The first rule of Positivist methodology is to consider social facts as things which means that the belief systems and customs of the social world should be considered as things in the same way as the objects and events of the natural world.

According to Durkheim, some of the key features of social facts are:

  • they exist over and above individual consciousness
  • they are not chosen by individuals and cannot be changed by will
  • each person is limited (constrained) by social facts

According to Durkheim what effects do social facts make people act in certain ways, in the same way as door limits the means whereby you can enter a room or gravity limits how far you can jump.

Positivists believed that we should only study what can be observed and measured(objective facts), not subjective thoughts and feelings. The role of human consciousness is irrelevant to explaining human behaviour according to Positivists because humans have little or no choice over how they behave.

For a more in-depth account of social facts, have a look at this blog post: What are Social Facts?

Statistical data, Correlation, and Causation

Positivists believed it was possible to classify the social world in an objective way. Using these classifications it was then possible to count sets of observable facts and so produce statistics.

The point of identifying social facts was to look for correlations – a correlation is a tendency for two or more things to be found together, and it may refer to the strength of the relationship between them.

If there is a strong correlation between two ore more types of social phenomena then a positivist sociologist might suspect that one of these phenomena is causing the other to take place. However, this is not necessarily the case and it is important to analyse the data before any conclusion is reach.

Spurious Correlations

Spurious correlations pose a problem for Positivist research. A spurious correlation is when two or more phenomena are found together but have no direct connection to each other: one does not therefor cause the other. For example although more working class people commit crime, this may be because more men are found in the working classes – so the significant relationship might be between gender and crime, not between class and crime.

Multivariate Analysis

Positivists engage in multivariate analysis to overcome the problem of spurious correlations.

Multivariate Analysis involves isolating the effect of a particular independent variable upon a particular dependent variable. This can be done by holding one independent variable constant and changing the other. In the example above this might mean comparing the crime rates of men and women in the working class.

Positivists believe multivariate analysis can establish causal connections between two or more variables and once analysis is checked establish the laws of human behaviour.

Positivism – Establishing the Laws of Human Behaviour

A scientific law is a statement about the relationship between two or more phenomena which is true in all circumstances.

According to Positivists, the laws of human behaviour can be discovered by the collection of objective facts about the world in statistical form and uncovering correlations between them, checked for their significance by multivariate analysis.

Positivism and The Comparative Method

The comparative method involves the use of comparisons between different societies, or different points in time

The purpose of using the comparative method is to establish correlations, and ultimately causal connections, seek laws and test hypotheses.

The comparative method overcomes the following disadvantages of experiments:

  • Moral problems are not as acute
  • The research is less likely to affect the behaviour or those being studied because we are looking at natural settings
  • The comparative method is superior to the experimental method because allows the sociologist to explore large scale social changes and changes over time

However, a fundamental problem with the comparative method is that the data you want may not be available, and you are limited to that data which already exists or which can be collected on a large scale via social surveys.

Related Posts

Positivism and Interpretivism in social research

Social Action Theory – criticises the positivist approach to social research, arguing that human consciousness is too complex to reduce to numbers.


Education in America

Key statistics on education in America, and the key features of the American education system including primary, secondary and tertiary education, the national curriculum and the examinations system.

This is part of a new set of posts designed to help students assess how developed countries are in terms of some of the key indicators of development such as economics, inequality, education, health, gender equality, peacefulness and so on…

America is an interesting case study because it is the wealthiest nation on earth in terms of total GDP, and very wealthy in terms of GNI per capita, but these high levels of wealth and income do not translate into social development for all.

This is a summary post at first, to be expanded on later…

America: Key Education Statistics

Core education statistics taken from World Bank data 

  • Pre-primary net enrollment rate – 63.8%
  • Primary enrollment rate – 93.1%
  • Secondary enrollment rate -90.5%
  • Tertiary enrollment rate – 86.7%
  • Out of school children – 1.5 million !
  • Government expenditure on education as percentage of GDP – 5.2%.

Education stats taken from other sources

Pisa Rankings (2015)

  • Science – 24th
  • Maths – 25th
  • Reading – 39th

Key Features of the American Education System 

Kindergarten, Primary, and Secondary Education in America

Schooling is compulsory for all children in the United States, with every child being entitled to a minimum of 12 years publicly funded education. Some states add on an additional year of pre-primary ‘Kindergarten) education, and the school leaving age also varies from state to state: some states allow students to leave school between 14–17 with parental permission, other states require students to stay in school until age 18.

American education

Children attend primary school from the ages of 6-11 where they are taught basic subjects, typically in a diverse, mixed ability class, with one teacher.

Children attend secondary school from the ages of 12-17, which is subdivided into junior high-school and senior high school. Here students are typically taught in different classes for different subjects and are allowed some degree of freedom to choose ‘elective subjects’.

While there is no overarching national curriculum, education in secondary school generally consists of 2–4 years of each of science, Mathematics, English, Social sciences, Physical education; some years of a foreign language and some form of art education, as well as the usual PSHE.

Many high schools provide ‘Honors classes’ for the more academically able during the 11th or 12th grade of high school and/ or offer the International Baccalaureate (IB).

The National (And Hidden) Curriculum

While there isn’t a national curriculum in America, there are some very detailed national common core standards in subject areas such as English and Maths – so why schools aren’t told what books they should actually get students to read, or how to teach maths, the standards dictate that they must spend a certain amount of time teaching these and other subjects…. When I say detailed, they really are – the standards on English stretch to over 60 pages.

In terms of the Hidden Curriculum – 50% of schools require their students to pledge allegiance as part of their daily routine, which I guess is an attempt to enforce a sense of national identity.

If you’re American I imagine this gives you a warm glowing feeling, if you’re not you’re probably fluctuating between an uncomfortable feeling of nausea and wondering WTF this has got to do with ‘liberty’. NB note the doting parents looking on, and that YouTube is full of this sort of thing.  


Differential Educational Achievement in America

The education system clearly doesn’t work for everyone equally – around 3 million students between the ages of 16 and 24 drop out of high school each year, a rate of 6.6 percent as of 2012.

Unsurprisingly, there are considerable ethnic differences in educational achievement in America, as this data from 2009 suggests:

ethnicity education America


Sources (those not included in links above!)

Wikipedia entry – Education in the United States

An overview of American education

How I would’ve answered the families and households section of A level sociology paper 2 (AQA, 2017)

Hints and tips on how I would’ve answered the A level sociology exam paper 2, 2017 (families and households section)

2017 Paper two exam questions and answers

Question 04: Outline and explain two ways in which changing gender roles within the family may have affected children’s experience of childhood…

For starters, identify two changes to gender roles – three obvious ones to target include:

  • the fact that both men and women now work
  • The fact that child care and parenting roles have changed
  • the fact that there is greater equality in the domestic division of labour

Then you simply need to link these to aspects of the experience of childhood:

  • Toxic childhood
  • disappearance of childhood
  • basic socialisation
  • age of parents
  • family size (number of siblings)
  • marriage and divorce

You could also criticise the extent to which things have actually changed!

Question 05: Analyse two ways in which migration patterns may have affected family structures…

I covered this in this recent blog post here

Question 06: Applying material from item D, and your own knowledge, evaluate functionalist explanations of the role of the family in society (20)

This really does just appear to be a standard ‘evaluate functionalism’ essay – all you need to do is a basic intro to functionalism, then your four standard points – Murdoch, Parson’s functional fit theory, stabilisation of adult personalities and gender roles, then conclude.

The item (which I won’t reproduce here) is pretty standard – it just wants you to emphasise increasing family diversity and the fact that families may well be dysfunctional, so evaluating from mainly radical feminism, and Postmodernism and the personal life perspective…!

Not a bad half of a paper TBH.

A Level Sociology Families and Households Revision Bundle

Families Revision Bundle CoverIf you like this sort of thing, then you might like my A Level  Sociology Families and Households Revision Bundle which contains the following:

  1. 50 pages of revision notes covering all of the sub-topics within families and households
  2. mind maps in pdf and png format – 9 in total, covering perspectives on the family
  3. short answer exam practice questions and exemplar answers – 3 examples of the 10 mark, ‘outline and explain’ question.
  4.  9 essays/ essay plans spanning all the topics within the families and households topic.


Analyse two ways in which migration has affected household structures (10)

How to get full marks for a 10 mark ‘item’ question in sociology A-level.

This question cam up as part of the families and households option in A level sociology paper 2 (topics in sociology), June 2017.

Item C

In the 1950s, most immigrants into the United Kingdom came from Commonwealth countries such as India and Jamaica. More recently, many immigrants have come from European countries such as Poland. May immigrants are young adults seeking work. 

These migration patterns have affected household structures. 

Applying material from Item C, analyse two ways in which migration patterns have affected household structures in the United Kingdom. 

Answer (hints and tips)

Point one – has to be about the variation in Caribbean and Indian household structures… quite easy I think… Of course you could talk about both separately.

Point two – asks that that you talk about more recent structures, drawing on Polish immigration.

What kind of household structures could you discuss?

  • Number of people in the household – so single person, or multiple occupancy.
  • The relationships between the people in the household – married or not? Friends or families? Ages?
  • Gender roles in those households – domestic division of labour
  • Numbers of adults and children (e.g. single person households)
  • Matrifocal/ Patrifocal household
  • The relationships between people in one household and other households (maybe a useful way to demonstrated analysis)
  • Generational variations…

So a potential answer might look like this:

Point one – focusing on Caribbean and Indian migration

  • Caribbean households – 60% single parent families
  • Link to male unemployment/ racism in society
  • matrifocal households
  • Contrast to Indian households
  • Higher rate marriage/ lower rate divorce
  • But later generations – divorce more likely
  • Discuss Mixed race couples

Point two – focusing on European migration

Almost certainly less you can say about this! But as long as you’ve made the most of the previous point, you could easily get into the top mark band… 

  • Younger age structure
  • More likely to have children and be married
  • Higher proportion of married families with children
  • Probably more shared-households – younger people without children sharing.

Commentary

This is a pretty straightforward question on a sub-topic within demography on how migration has affected family life in the U.K. so absolutely fair enough to ask it as a question.

However, it does concern me that the AQA’s online specification explicitly directs teachers to really dated material, and most of the text books focus on this, while this exam question expects students to know about recent events relating to migration and the family which are neither on their online specification or in any of the major A level text books.

I think the AQA needs to relax it’s focus on that really dated material (the classic question on ‘Functionalism and the Family’ in the same paper is a good example of how students are expected to know in-depth this stuff from the 1950s) if it’s going to demand a more contemporary focus.

There’s absolutely nothing wrong with a contemporary focus, just all that dated material that was such a waste of time students learning (like Pahl and Volger FFS), just in case it came up. This is a real problem because it makes sociology lose credibility, undermining the discipline.

Critics might say this problem emerges from the fact that whoever sets the agenda for the AQA families and households syllabus is something of a timeserver who can’t be bothered to update the specification appropriately by cutting down all the dated material. They might cite as evidence for this the fact that the specification hasn’t really changed significantly in 30 years.

Full answer from the AQA 

Below is an example of an abbreviated (by me) marked response to this question, which achieved a top band-mark, 10/10 in fact!

The example is taken from the 2017 Education with Theory and Methods Paper (paper and mark schemes available from the AQA website).

The Question with Item 

10-mark-question-item-sociology

The Mark Scheme (top band only)

10-mark-question-item-mark-top-band-sociology.png

Student Response:

Item C points out that most immigrants come to Britain from commonwealth countries such as Jamaica. Bertod did a study of Caribbean families which found a type of individualism: the norm that people had to right to be free within marriage even if they had a child with the other person. This meant many Caribbean fathers chose not to stay with the mother of their children, leading to an increase in lone parent families.

Thus it follows that the increase in Caribbean immigration has lead to an increase in single parent families which is up from 10% in the 1970s to 23% today.

Item C also says that immigrants come from India. A study by Ballard found that South East Asians have collective, traditional values and tight knit extended families which support traditional family values – women having many children and being in the expressive role, and men in the breadwinner role, with close ties to grandparents.

This should mean an increase in traditional extended families in the UK due to Indian immigration, however the statistics do not confirm this as the divorce rate has increased dramatically since the 1970s. This does not support the idea of increased traditional families as these value marriages.

However, functionalists argue that divorce can be healthy as it there is better quality relationships in surviving marriages and remarriages.

Examiner Commentary:

Mark: 10/10

aqa-sociology-paper-2-commentary.png

KT’s commentary:

  • This is overkill, easily 10/10!
  • Apparently 4 students died instantly of boredom on seeing the question because of reference to yet more sociology from before their parents were born. 

Source:

A-level
SOCIOLOGY
Feedback on the Examinations
Student responses and commentaries: Paper 1 7192/2 Topics in Sociology
Published: Autumn 2017

NB – this document is NOT available on the AQA website, but any teacher should have access to it via eaqa. I’m sharing it here in order to make the exam standards more accessible, and to support the AQA in their equality and meritocratic agendas, because there will be some poor students somewhere whose teachers aren’t organised enough to access this material for them. 

Experiments in Sociology – Revision Notes

Definitions, key features and the theoretical, practical and ethical strengths and limitations of laboratory and field experiments applied to sociology (and psychology). Also covers key terms related to experiments.

post has been written to help students revising for the research methods aspect of their second year A-level exams.

Experiments – The Basics: Definitions/ Key Features

  • Experiments aim to measure the effect which one or more independent variables have on a dependent variable.
  • The aim is to isolate and measure as precisely as possible the exact effect independent variables have on dependent variables.
  • Experiments typically aim to test a ‘hypothesis’ – a prediction about how one variable will effect another.
  • There are two main types* of experimental method: The Laboratory experiment, the field experiment and the comparative method.
    • Laboratory Experiments take place in an artificial, controlled environment such as a laboratory.
    • Field Experiments – take place in a real world context such as a school or a hospital.

Advantages of Laboratory Experiments

  • Theoretical – The controlled conditions of laboratory experiments allow researchers to isolate variables: you can precisely measure the exact effect of one thing on another.
  • Theoretical – You can establish cause and effect relationships.
  • Theoretical – You can collect ‘objective’ knowledge – about how facts ‘out there’ affect individuals.
  • Theoretical – Good Reliability because it is easy to replicate the exact same conditions.
  • Theoretical – Good Reliability because of the high level of detachment between the researcher and the respondent.
  • Practical – Easy to attract funding because of the prestige of science.
  • Practical – Take place in one setting so researchers can conduct research like any other day-job – no need to chase respondents.
  • Ethical – Most laboratory experiments seek to gain informed consent, often a requirement to get funding.
  • Ethical – Legality – lab experiments rarely ask participants to do anything illegal.
  • Ethical – Findings benefit society – both Milgram and Zimbardo would claim the shocking findings of their research outweigh the harms done to respondents.

Disadvantages of Laboratory Experiments

  • Theoretical – They are reductionist: human behaviour cannot be explained through simple cause and effect relationships (people are not ‘puppets’).
  • Theoretical – Laboratory experiments lack external validity – the artificial environment is so far removed from real-life that the results tell us very little about how respondents would actually act in real life.
  • Theoretical – The Hawthorne Effect may further reduce validity – respondents may act differently just because they know they are part of an experiment.
  • Theoretical – They are small scale and thus unrepresentative.
  • Practical – It is impractical to observe large scale social processes in a laboratory – you cannot get whole towns, let alone countries of people into the small scale setting of a laboratory.
  • Practical – Time – Small samples mean you will need to conduct consecutive experiments on small groups if you want large samples, which will take time
  • Ethical – Deception and lack of informed consent – it is often necessary to deceive subjects as to the true nature of the experiment so that they do not act differently. Links to the Hawthorne Effect.
  • Ethical – Some specific experiments have resulted in harm to respondents – in the Milgram experiment for example.
  • Ethical – Interpretivists may be uncomfortable with the unequal relationships between researcher and respondent – the researcher takes on the role of the expert, who decides what is worth knowing in advance of the experiment.

Advantages of Field Experiments over Laboratory Experiments

  • Theoretical – They generally have better validity than lab experiments because they take place in real life settings
  • Theoretical – Better external validity – because they take place in normally occurring, real-world social settings.
  • Practical – Larger scale settings – you can do field experiments in schools or workplaces, so you can observe large scale social processes, which isn’t possible with laboratory experiments.
  • Practical – a researcher can ‘set up’ a field experiment and let it run for a year, and then come back later.

The relative disadvantages of Field Experiments

  • Theoretical – It is not possible to control variables as closely as with laboratory experiments – because it’s impossible to observe respondents 100% of the time.
  • Theoretical – Reliability is weaker – because it’s more difficult to replicate the exact context of the research again.
  • Theoretical – The Hawthorne Effect (or Experimental Effect) may reduce the validity of results.
  • Practical Problems – access is likely to be more of a problem with lab experiments. Schools and workplaces might be reluctant to allow researchers in.
  • Ethical Problems – As with lab experiments – it is often possible to not inform people that an experiment is taking place in order for them to act naturally, so the issues of deception and lack of informed consent apply here too, as does the issue of harm.

Experiments – Key Terms Summary

Hypothesis – a theory or explanation made on the basis of limited evidence as a starting point for further investigation. A hypothesis will typically take the form of a testable statement about the effect which one or more independent variables will have on the dependent variable.

Dependent Variable – this is the object of the study in the experiment, the variable which will (possibly) be effected by the independent variables.

Independent variables – The variables which are varied in an experiment – the factors which the experimenter changes in order to measure the effect they have on the dependent variable.

Extraneous variables – Variables which are not of interest to the researcher but which may interfere with the results of an experiment

Experimental group – The group under study in the investigation.

Control group – The group which is similar to the study group who are held constant. Following the experiment the experimental group can be compared to the control group to measure the extent of the impact (if any) of the independent variables.

You should also know about natural experiments/ the comparative method –involves comparing two or more societies or groups which are similar in some respects but varied in others, and looking for correlations.  

Signposting

This post has been written to help students revising for the research methods aspect of their second year A-level exams.

These are the more in-depth posts on experiments

Experiments in sociology – an introduction

Laboratory experiments in sociology

Field experiments in sociology

Does the Mainstream Media Influence our Voting Behaviour?

The Independent recently reported that only 28% of Sun readers voted the way the paper wanted them to.


This is the lead into a brief article about the Sun’s waning influence over it’s readers – as the article points out that the paper ran an anti-Corbyn campaign, which it did, and some of the headlines and articles were shockingly one-sided:

However, I think the 28% figure above is a bit misleading. You only get this when you calculate in the low turnout by Sun readers, the lowest of all the readerships of the major newspapers, with a turnout of only 48%.

Of those who voted, 62%, or nearly 2/3rds of Sun readers voted for either the Tories or UKIP.’


The article then goes on to point out that the swing in this election was 16% points away from UKIP, 12% gain for the Tories, and 6% gain for Labour, meaning that above headline is at least somewhat misleading.

A few things to note here

  • While objectively true (only 28% of Sun readers did vote Tory, it’s true!), this is a good  example of how sound bite snap-shot statements of stats do not actually give you an accurate picture of what’s going on. You need to know that 48% didn’t vote, and that of those who did vote, almost 2/3rds of them voted Tory! AND the swing was mainly away from UKIP.
  • This article shows you a good example of how subjective political biases in reporting can distort the objective statistical facts (of course there are problems with those too, more of that here) – Obviously there’s the example of the bias in The Sun itself, but there’s also bias in The Independent’s (sorry, the ‘Independent’) reporting of the bias in The Sun. The ‘Independent’ is a left wing newspaper, as the above snapshot on how its readers vote handily shows us, and so it leads with a story about how The Sun is waning in influence, the kind of thing its readers will want to hear as they’re currently caught up in Tory-turmoil rapture, suggestion this is biased reporting designed to appeal to people’s emotions.
  • Finally, surely the real headline should be just how many Sun voters didn’t show up to vote – this seems to be a case of the working classes dissociating themselves from the formal political process rather than not voting Tory? Or more thrilling is the increase from 0% to 1% of Sun Readers voting Green, an infinite increase…!

Finally, having said all of this, I actually think The Sun today has less influence over its readers, but the evidence here isn’t sufficient to come to such a conclusion.

What the article should have done to prove this more conclusively is to compare the paper’s 2015 election content to it’s readership’s voting behaviour,  and then compared that to the 2017 relationship.

And doing that would require a more complex metholodogy which wouldn’t fit in with the newspaper’s publishing schedule.


Milgram’s Obedience Experiment – Strengths and Limitations

A laboratory experiment designed to test how obedient people are to authority.

Milgram’s obedience experiment is one of the most useful examples to illustrate the strengths and limitations of laboratory experiments in psychology/ sociology, as well as revealing the punishingly depressing findings that people are remarkably passive in the face of authority…

This post outlines details of the original experiment and two recent, televised repeats by the BBC (2008) and for Darren Brown’s ‘The Heist’ (2014).

danger severe shock: milgram!

The Original Obedience Experiment (1963)

Milgram (1963) was interested in researching how far people would go in obeying an instruction if it involved harming another person. Stanley Milgram was interested in how easily ordinary people could be influenced into committing atrocities for example, Germans in WWII.

The video below is quite long, but you can selectively watch it to get an idea of the procedure (which is outlined below)

Procedure

Volunteers were recruited for a lab experiment investigating “learning” (re: ethics: deception). Participants were 40 males, aged between 20 and 50, whose jobs ranged from unskilled to professional, from the New Haven area. They were paid $4.50 for just turning up.

At the beginning of the experiment they were introduced to another participant, who was actually an associate of the experimenter (Milgram). They drew straws to determine their roles – learner or teacher – although this was fixed and the confederate was always the learner. There was also an “experimenter” dressed in a grey lab coat, played by an actor.

Two rooms in the Yale Interaction Laboratory were used – one for the learner (with an electric chair) and another for the teacher and experimenter with an electric shock generator.

a diagram showing the roles in the milgram experiment
A diagram illustrating the Milgram Experiment

The “learner” was strapped to a chair with electrodes. After he has learned a list of word pairs given him to learn, the “teacher” tests him by naming a word and asking the learner to recall its partner/pair from a list of four possible choices.

The teacher is told to administer an electric shock every time the learner makes a mistake, increasing the level of shock each time. There were 30 switches on the shock generator marked from 15 volts (slight shock) to 450 (danger – severe shock).

The learner gave mainly wrong answers (on purpose) and for each of these the teacher gave him an electric shock. When the teacher refused to administer a shock the experimenter was to give a series of orders / prods to ensure they continued. There were 4 prods and if one was not obeyed then the experimenter read out the next prod, and so on.

  • Prod 1: please continue.
  • Prod 2: the experiment requires you to continue.
  • Prod 3: It is absolutely essential that you continue.
  • Prod 4: you have no other choice but to continue.
a respondent in milgram's obedience experiment.
A respondent administering a shock for a wrong answer

Results

65% (two-thirds) of participants (i.e. teachers) continued to the highest level of 450 volts. All the participants continued to 300 volts.

Milgram did more than one experiment – he carried out 18 variations of his study. All he did was alter the situation (IV) to see how this affected obedience (DV).

Conclusion

Ordinary people are likely to follow orders given by an authority figure, even to the extent of killing an innocent human being. Obedience to authority is ingrained in us all from the way we are brought up.

People tend to obey orders from other people if they recognize their authority as morally right and / or legally based. This response to legitimate authority is learned in a variety of situations, for example in the family, school and workplace.

Despite the many ethical pitfalls of this experiment, some participants still believed the benefits outweighed the costs – below is the view of one participant…“While I was a subject in 1964, though I believed that I was hurting someone, I was totally unaware of why I was doing so. Few people ever realize when they are acting according to their own beliefs and when they are meekly submitting to authority… To permit myself to be drafted with the understanding that I am submitting to authority’s demand to do something very wrong would make me frightened of myself… I am fully prepared to go to jail if I am not granted Conscientious Objector status. Indeed, it is the only course I could take to be faithful to what I believe. My only hope is that members of my board act equally according to their conscience…”

More recent video repeats of the Milgram experiment:

The BBC did a documentary in 2008 in which 12 people were subjected to what seems to be the same experiment, and a similar results found. Vimeo link here.

contemporary version of milgram's obedience experiment.
‘Sorry, that’s the wrong answer, 450 volts’ (giggle)

Darren Brown also did a more recent re-run of the Milgram obedience experiment in order to test people’s responses to authority as part of his 2014 programme ‘The Heist’ – interestingly in this, one participant says they can’t carry on because they’ve heard of the experiment (even though they seem to have started it), while another who hadn’t heard of it comments that they needed more buttons on the shock machine.

Strengths and Limitations of Milgram’s Obedience Experiment

The above experiment illustrates many of the advantages and disadvantages of using laboratory experiments in psychology and sociology.

Some of the obvious advantages include the fact that it’s got excellent reliability, given the similar results gained on the two repeats, and it’s still a useful tool for waking us up to just how quiescent to authority many of us are, challenging theories such as the flight from deference.

It also illustrates many of the limitations of experiments – it is still extremely artificial, not true to real life because authority manifests itself in vastly different ways (as teachers, police and so on, not scientists), and the Hawthorne Effect is very nicely illustrate in the Darren Browne clip above (seriously has not EVERYONE heard of the Milgram experiment by now?!, or is that just my middle class cultural bias?), and then of course, there’s the ethics – Darren Browne actually comments that it took one of the respondents too long to recover from the experiment, so he doesn’t select her for the next stage of ‘The Heist’.

milgram's obedience experiment, a respondent
One of the original respondents showing signs of distress
References

Milgram’s Experiment on Obedience to Authority, which cites Milgram, S. (1974). Obedience to Authority: An Experimental View. New York: Harper and Row. An excellent presentation of Milgram�s work is also found in Brown, R. (1986). Social Forces in Obedience and Rebellion. Social Psychology: The Second Edition. New York: The Free Press.

Signposting

Laboratory Experiments are one of the main methods taught as part of the Research Methods topic within A-level sociology.

You might also like this more general post on the strengths and limitations of laboratory experiments.

Please click here to return to the homepage – ReviseSociology.com

Surveys on Family Life in the UK

Social Surveys are one of the most common methods for routinely collecting data in sociology and the social sciences more generally. There are lots of examples of where we use social surveys throughout the families and households module in the A level sociology syllabus – so what do they tell us about family life in modern Britain, and what are their strengths and limitations….?

This information should be useful for both families and households and for exploring the strengths and limitations of social surveys for research methods

Attitudes to non-traditional families

Findings from British Social Attitudes 37 suggests that the British public is becoming more supportive of non-traditional families.

Headline Fact – in 2018/19 only 12% of the UK population disapproved of people having children while cohabiting, down from 22% in 2006/07.

tables of statistics showing changes in attitudes to non traditional families in the UK 2007-2019.

Disapproval for all types of non-traditional families decreased between 2006/7 and 2018/19.

Further analysis demonstrated this was due to a generational affect. In the previous round of surveys (2006/07) 50% of people born before 1927 disapproved of traditional families. However most of these had died by 2018/19 and so their attitudes did not show up in these later survey results.

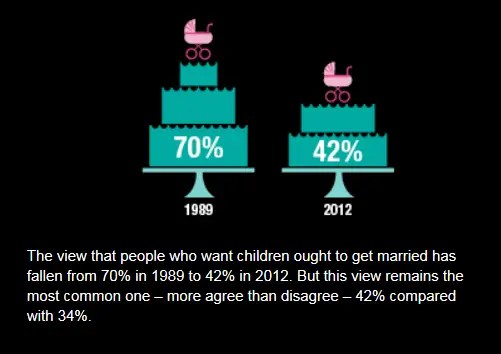
Back in 1989, seven people in ten (70%) felt that people should be married if they want to have children, compared with less two in ten (17%) who disagreed.

The number of people who think couples should get married before having children has fallen dramatically in the last 40 years. In 1989 70% of people believed couples should get married before having children. This had fallen to 42% in 2012.

Percentage of the UK population who agree that parents should be married before they have children.

Judging by the low 12% disapproval rate for ‘cohabiting with children’ it seems reasonable to say that even fewer people think couples need to get married before having children in 2023!

What are the strengths of this survey

  • I’m tempted to say the validity is probably quite good, as this isn’t a particularly sensitive topic, and the focus of the questions is the ‘generalised other’, so there should be no social desirability.
  • It’s very useful for making comparisons over time – given that the same questions have been asked in pretty much the same way over different years.
  • Representativeness seems to be OK – NatCen sampled a range of ages, and people with different political views, so we can compare all that too – no surprises here btw – the old and the conservatives are more likely to be in favour of marriage.

What are the limitations of this survey?

The question above is so generalised, it might give us a false impression of how liberal people are. I wonder how much the results would change if you made the questions more personal – would you rather your own son/ daughter should be married before they had children? Or just different – ‘all other things being equal, it’s better for children to be brought up by married parents, rather than by non-married-parents’ – and then likehert scale it. Of course that question itself is maybe just a little leading….

Housework Surveys 

Headline ‘fact’ – women still do 60% more housework than men (based on ONS data from 2014-15)

housework UK

Women carry out an overall average of 60% more unpaid work than men, ONS analysis has shown.

Women put in more than double the proportion of unpaid work when it comes to cooking, childcare and housework and on average men do 16 hours a week of such unpaid work compared to the 26 hours of unpaid work done by women a week.

The only area where men put in more unpaid work hours than women is in the provision of transport – this includes driving themselves and others around, as well as commuting to work.

This data is derived from the The UK Time Diary Study (2014-15) – which used a combination of time-use surveys and interviews to collect data from around 9000 people in 4000 households.

It’s worth noting that even though the respondents were merely filling in a few pages worth of diary, this document contains over 200 pages of technical details, mainly advice on how researchers are supposed to code responses.

What are the strengths of this survey?

  • The usual ease of comparison. You can clearly see the differences in hours between men and women – NB the survey also shows differences by age and social class, but I haven’t included that here (to keep things brief).
  • It’s a relatively simply topic, so there’s unlikely to be any validity errors due to interpretation on the part of people completing the surveys: it’s obvious what ‘washing clothes’ means for example.
  • This seems to suggest the continued relevance of Feminism to helping us understand and combat gender inequality in the private sphere.

What are the limitations of this data? 

  • click on the above link and you’ll find that there is only a 50% response rate…. which makes the representativeness of this data questionable. If we take into account social desirability, then surely those couples with more equal housework patterns will more likely to return then, and also the busier the couple, the less likely they are to do the surveys. NO, really not convinced about the representativeness here!
  • this research tells us nothing about why these inequalities exist – to what extent is this situation freely chosen, and to what extent is it down to an ‘oppressive socialisation into traditional gender norms’ or just straightforward coercion?
  • given all of the coding involved, I’m not even convinced that this is really that practically advantageous…. overall this research seems to have taken quite a long time, which is a problem given the first criticism above!

Surveys on Children’s Media Usage

TikTok, Snapchat and Instagram are the most popular social media apps used by teenagers. Around 40% of teenagers use these three apps.

bar chart showing percentages of children who use social media, UK 2023.

Facebook usage among teens has decreased in recent years.

The data which produced these results comes from three separate tracking studies with a combined sample of over 10 000 children and their parents, data collected between March-November 2022. (OFCOM: Children and Parents: Media Use and Attitude Report).

Strengths of this Survey

  • It makes comparisons over time easy, as the same questions are asked over a number of different years.
  • Other than that, I think there are more problems!

Limitations of this Survey

  • There are no details of how the sample was achieved in the methodology – so I can’t comment on the representativeness.
  • There is so much data here it’s difficult to get an overview. For example there are no longer any easily accessible stats on how much total time children spend with media. The figures are broken down by media type, split into TV, gaming and social media for example.
SIGNPOSTING AND RELATED POSTS.

This material is mainly relevant to the families and households module, usually taught as part of the first year in A-level sociology.

Why Do Voting Opinion Polls Get it Wrong So Often?

Surveys which ask how people intend to vote in major elections seem to get it wrong more often than not, but why is this?

Taking the averages of all nine first and then final polls for the UK general election 2017, the predictions for the Conservatives show them down from 46% to 44%; and Labour up from 26% to 36%.

voting intention 2017 general election

The actual vote share following the result of the general election shows the Conservatives at 42% and Labour at 40% share of the vote.

2017 election result share of vote UK

Writing in The Guardian, David Lipsey notes that ‘The polls’ results in British general elections recently have not been impressive. They were rightish (in the sense of picking the right winner) in 1997, 2001, 2005 and 2010. They were catastrophically wrong in 1992 and 2015. As they would pick the right winner by chance one time in two, an actual success rate of 67%, against success by pin of 50%, is not impressive.’

So why do the pollsters get it wrong so often?

Firstly, there is a plus or minus 2 or 3% statistical margin of error in a poll – so if a poll shows the Tories on 40% and Labour on 34%, this could mean that the real situation is Tory 43%, Labour 31% – a 12 point lead. Or it could mean both Tory and Labour are on 37%, neck and neck.

This is demonstrated by these handy diagrams from YouGov’s polling data on voting intentions during the run up to the 2017 UK general election…

Voting Intention 2017 Election 

Statistics Margin Error.png

Seat estimates 2017 General Election

Seat Estimates

Based on the above, taking into account margin for error, it is impossible to predict who would have won a higher proportion of the votes and more seats out of Labour and the Tories.

Secondly, the pollsters have no way of knowing whether they are interviewing a representative sample.

When approached by a pollster most voters refuse to answer and the pollster has very little idea whether these non-respondents are or are not differently inclined from those who do respond. In the trade, this is referred to as polling’s “dirty little secret”.

Thirdly, the link between demographic data and voting patterns is less clear today – it used to be possible to triangulate polling data with demographic data from previous election results, but voter de-alignment now means that such data is now less reliable as a source of triangulating the opinion polls survey data, meaning pollsters are more in the dark than ever.

Fourthly, a whole load of other factors affected people’s actual voting behaviour in this 2017 election and maybe the polls  failed to capture this?

David Cowley from the BBC notes that…. ‘it seems that whether people voted Leave or Remain in 2016’s European referendum played a significant part in whether they voted Conservative or Labour this time…. Did the 2017 campaign polls factor this sufficiently into the modelling of their data? If younger voters came out in bigger numbers, were the polls equipped to capture this, when all experience for many years has shown this age group recording the lowest turnout?’

So it would seem that voting-intention surveys have always had limited validity, and that, if anything, this validity problem is getting worse…. after years of over-estimating the number of Labour votes, they’ve now swung right back the other way to underestimating the popularity of Labour.

Having said that these polls are not entirely useless, they did still manage to predict that the Tories would win more votes and seats than Labour, but they just got the difference between them oh so very wrong.

The problem of obtaining representative samples (these days)

According to The Week (July 2017) – the main problem with polling these days is that finding representative samples is getting harder… When Gallup was polling, the response rate was 90%, in 2015, ICM had to call up 30 000 numbers just to get 2000 responses. And those who do respond are often too politically engaged to be representative.